Unless you've been hiding under a rock, you're probably aware that the U.S. stock market has been on fire in 2019. In fact, the S&P 500 Index (SPX) is on pace to top the key 2,800 level today, eyeing its highest close since early October, before the massive fourth-quarter sell-off. As such, the Cboe Volatility Index (VIX) -- also known as Wall Street's "fear gauge" -- has cooled its proverbial jets, more than halving since its late-December peak above $36. However, if recent history is any indicator, the VIX could be on the cusp of a breakout.
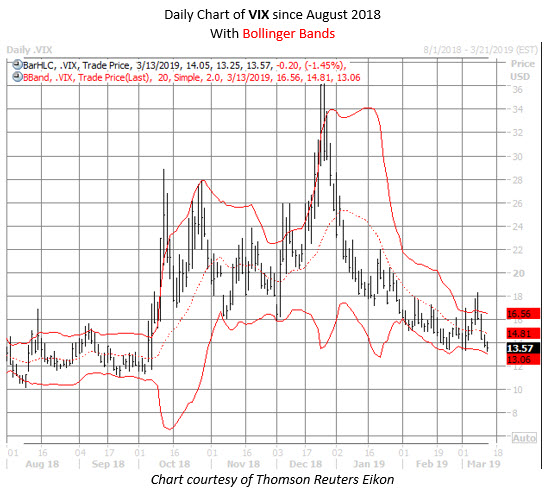
Specifically, the VIX's Bollinger Bands® recently narrowed to within 3.5 points -- a range similar to September, just before the aforementioned sell-off, as you can see on the chart below. Many traders use contracting bands as a signal that the underlying shares will see heightened volatility soon. Against this backdrop, we decided to take a look at how the VIX performs depending on the width of its Bollinger Bands.

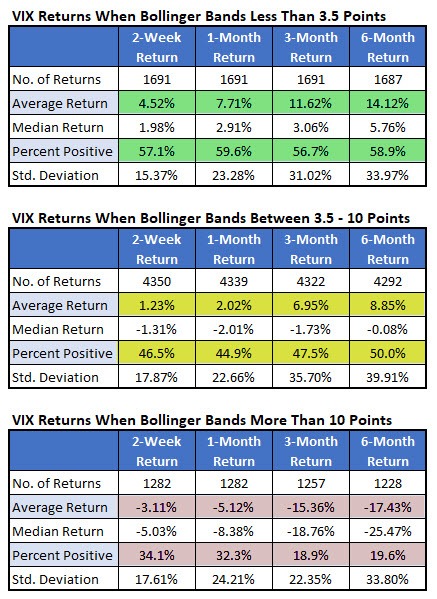
To analyze the data, Schaeffer's Senior Quantitative Analyst Rocky White broke down VIX returns into three groups based on the width of its Bollinger Bands: when they're within a range of less than 3.5 points, as we just saw; when they're between 3.5 and 10 points apart; and when they're wider than 10 points. The second grouping is most frequent, with over 4,300 returns since 1990 -- more than double the first grouping, and triple the last grouping.
Following a sub-3.50 signal, the VIX was higher more than 50% of the time at each checkpoint looking six months out. That's compared to a positive rate of 50% or lower across the board after VIX Bollinger Bands are wider. So, it's safe to conclude that the VIX is more likely to move higher when its Bollinger Bands are claustrophobic.
More specifically, two weeks after a sub-3.50 signal, the VIX was up 4.52%, on average -- about three times the average return when its bands were in a "normal" range. That's compared to an average two-week drop of 3.11% when VIX bands are more than 10 points apart.
It's a similar story looking six months out. After a sub-3.50 signal, the VIX was up 14.12%, on average, compared to an average gain of 8.85% after "normal" readings, and an average loss of 17.43% after readings of wide Bollinger Bands.

In conclusion, the data above indicates that when VIX Bollinger Bands get pinched -- to less than 3.5 points -- by a cooldown in day-to-day volatility, the "fear index" tends to move higher over the next six months. That's not too surprising, however, as volatility expectations for stocks ebb and flow, and narrowing bands often precede the end of a "quiet period" for the underlying -- in this case, the VIX.
In the short term, traders should monitor the VIX's dance around the 18 level, which represents roughly half the December closing high. A VIX close above this level could be a warning of an imminent spike in volatility, as Schaeffer's Senior V.P. of Research Todd Salamone noted in this week's Monday Morning Outlook. Plus, he added, recent Commitment of Traders (CoT) data indicates the next big VIX move will likely be to the upside, as large speculators have so often been on the wrong side of major volatility moves.
