No one likes to see a scary headline. No one enjoys seeing red screens and minus signs next to a daily percent change reading. Unfortunately, red days and red screens are a fact of life in the world of investing. It is easy to be "disciplined" on green days that are littered with plus signs.
THE IMPACT OF WEDNESDAY'S DOWN DAY
If you want to replace a negative habit in your life, one of the most effective ways is to replace it with a more constructive habit. Over-trading an investment account and/or checking your balance five times a day is a recipe for high stress and disappointing returns. Therefore, checking factual reference points can be much more productive than staring at red screens all day.
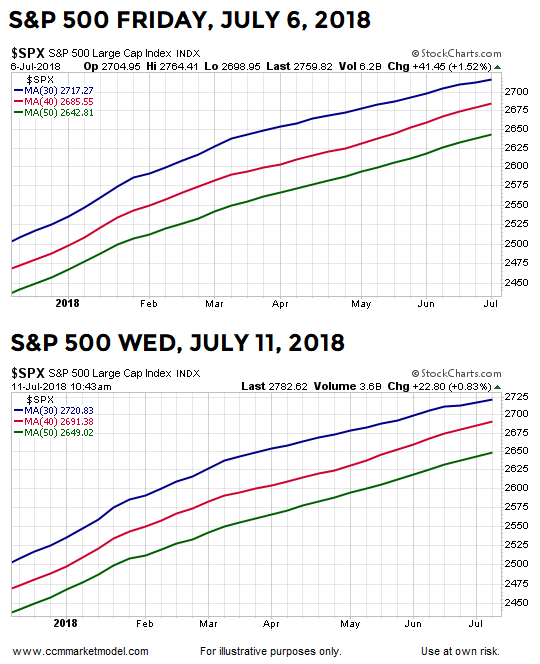
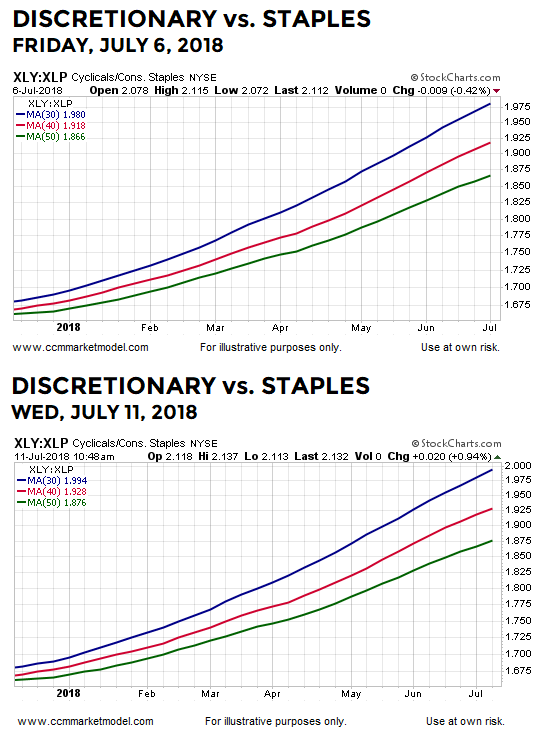
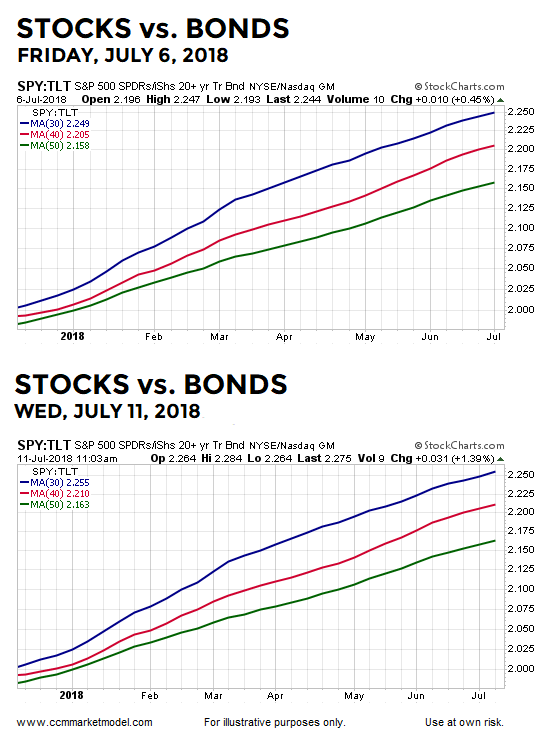
If you watched this week's video (available in the latter portions of this post), you may have thought those weight-of-the-evidence charts make a convincing long-term case to remain patient given what we know today. After watching the video earlier this week, the futures "tank" on Tuesday evening and the emotional side of our brains takes over. Thus, it might be helpful to compare the look of a few charts covered in the CCM weekly video as of last Friday's close relative to Wednesday's red session. Are the long-term trends on the ropes?
FRIDAY'S CLOSE vs. WEDNESDAY'S SESSION
Detailed commentary and historical context regarding the relevance of the charts below can be found in the video.

S&P 500 REMAINS IN THE SAME RANGE
Markets have three basic structures: uptrends, downtrends, and consolidation. Since peaking on January 26, 2018, the S&P 500 has been in an indecisive period of consolidation. Thus, the basic comments about a range and navigating from point A to point B still apply. As noted numerous times in recent months, under our approach if we try to trade and make numerous allocation adjustments inside a trading range, we will more than likely destroy value as opposed to creating value; patience is the key during periods of consolidation. Thus, we will continue to remain patient as long as the facts allow.
HOW DID THE CHARTS ABOVE LOOK DURING THE 2007 PEAKING PROCESS?
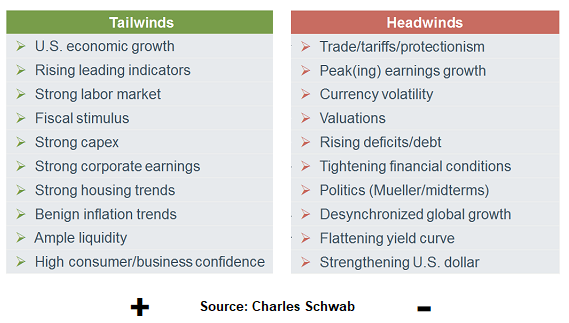
This week's video takes a hard look at both sides of the bull/bear ledger, as summarized via the Charles Schwab graphic below.

Long-term economic and market trends do not move based on media headlines, sound bites from talking heads, or personal opinions. Therefore, we can learn a lot about the market's take on the Ben Franklin list above by reviewing the present day facts covered in the video.
INVESTORS GREATLY UNDERESTIMATE MARKET VOLATILITY
As outlined in a March 2018 video, volatility is a normal part of all trends. For example, during a secular bull move between 1984 and 1987 that spanned 3873 trading days, 1761 of those trading days were red. Red days are a normal part of all trends. When viewed in isolation, red days tell us very little about the market's long-term potential. As Mr. Buffet noted, discipline is what separates the winners from the losers in the financials markets.


