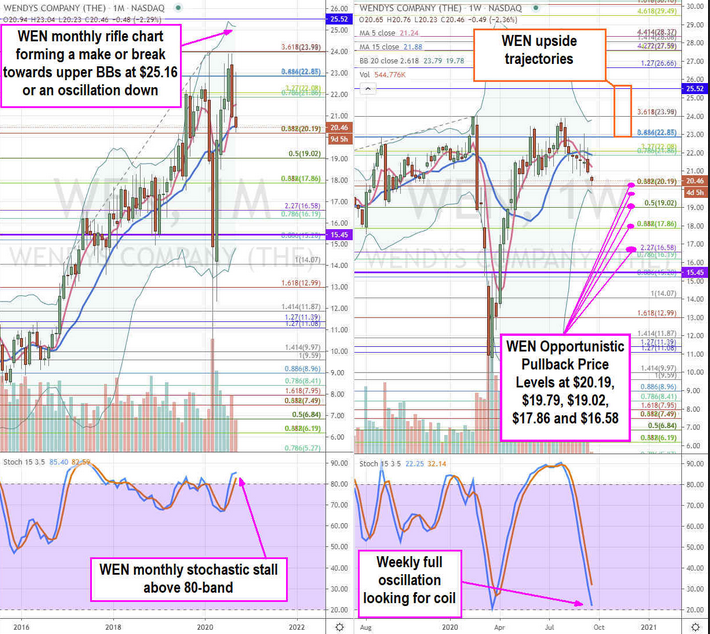
Fast food restaurant chain The Wendy’s Co (NASDAQ:WEN) shares sold off with the S&P 500 during the pandemic plunge commencing in late February 2020. Shares were able to recover back to pre-COVID highs but formed a double-top at the $23.98 price level.
Shares are currently in a downdraft setting up opportunistic pullback entry levels for risk-tolerant investors looking for an agile dual narrative play in the event economic restarts are pulled back or if a COVID-19 gets FDA approval.
Q2 FY 2020 Earnings Release
On Aug. 3, 2020, Wendy's reported its second-quarter fiscal 2020 results for the quarter ending June 2020. The Company reported an earnings-per-share (EPS) profit of $0.12 excluding non-recurring items versus consensus analyst estimates for a profit of $0.11, beating estimates by $0.01.
Revenues fell (-7.6%) year-over-year (YoY) to $402.3 million versus $411.29 million consensus analyst estimates. Same-store comparable sales fell (-5.8%) YoY. The Company ended the quarter with $275 million in cash and bolstered its revolver to $250 million. Wendy’s reinstated the $0.05 per share quarterly dividend and extended the $100 million stock buyback authorization by one-year.
Conference Call Takeaways
Sales have been recovering since the “low point” of the pandemic which was the end of March. The supply chain disruption for beef has passed. Wendy's launched breakfast daypart in early March and sees continue acceleration in sales as it sees breakfast as a growth driver delivering 8% of total sales for the quarter.
Digital sales grew to approximately 5% of total sales, mostly coming from delivery which is partnered with Uber Eats (NYSE:UBER). The customer loyalty program was launched in July aimed at driving customer frequency with compelling offers and rewards on Wendy’s products, which should boost mobile sign-ups and drive growth in mobile orders.
At the end of July, 70% of dining rooms are open for carry out. Margins dropped 210 basis points to 14.4% as a result of customer count declines and rise in labor costs. Drive-thru sales helped turn U.S. comparable same-store-sales (SSS) positive in June and July. The Company plans to bolster Q3 and Q4 growth with a $15 million incremental awareness and marketing promotional campaign.
NPC Bankruptcy
During the second quarter, a franchisor NPC filed for bankruptcy on July 1, 2020. It operates 385 Wendy’s restaurants domestically. This won’t have a material impact for Wendy’s as NPC plans to divest its portfolio of Wendy’s restaurants to new franchisees that the Company needs to approve. NPC Wendy’s restaurants are still open and operating. NPC has remained compliant with Wendy’s in accordance with its obligations.
Cold Winter Ahead
While the in-restaurant dining segment has seen rapid acceleration in shares due to the availability of outdoor seating and capped dining room seating, a frigid cold winter ahead may altogether eliminate the outdoor seating. Wendy’s is in a position to benefit in the event of rollbacks from a second wave COVID-19 shutdown as they ramp up their mobile loyalty programs. If a vaccine is approved, then Wendy’s benefits from more in-store dining expansion. The recent pullbacks can set-up opportunistic pullback levels for risk tolerant investors looking to scale into a position on this dual narrative benefactors.

WEN Opportunistic Pullback Levels
Using the rifle charts on the monthly and weekly time frames provides a broader view of the landscape for WEN stock. The monthly rifle chart stochastic managed to snap back up to continue its pre-COVID pup breakout but peaked three times off the $23.98 Fibonacci (fib) level. The monthly 5-period moving average (MA) and 15-period MA are attempting to hold supports at 21.52 and $20.53, respectively.
The weekly rifle chart triggered a market structure low (MSL) buy above $15.45 back in April 2020. The weekly stochastic has been in a full oscillation down after peaking off the $23.98 fib putting in a double top with lower weekly Bollinger Bands (BBs) at $19.78. While the weekly stochastic falls nears the 20-band oversold level, investors should be at the ready for opportunistic pullback levels at $20.19 fib, $19.79 weekly lower BBs, $19.02 fib, $17.86 double fib and $16.58 fib.
Since the monthly is in a make or break, the weekly stochastic needs to bottom and coil off the 20-band to set-up a coil back up to the monthly 5-period MA at $21.52. If that level breaks, then a retest of the double top/weekly upper BBs at $22.98 awaits. This is a very tough resistance but if broken then trigger a new leg higher towards the $25 to $25.50 range.
