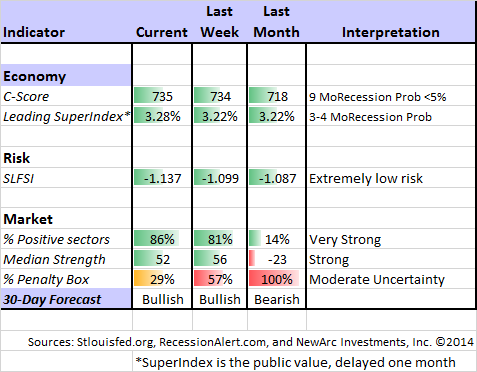
The upcoming calendar provides a mixed brew of inflation data, Fed news, and continuing world crises. Adding the recent daily focus on energy prices and skepticism about stocks leads to the likely media focus for the week:
Is it time to buy commodities?
Prior Theme Recap
In my last WTWA I predicted that a light week for data would produce a parade of pundits, all wondering whether it was too late to join the stock market rally. That was an accurate guess. Whether you were watching on financial TV or reading your favorite sources, there was an extra helping of commentary. It covered the full range from crashes and recessions to year-end rallies.
Feel free to join in my exercise in thinking about the upcoming theme. We would all like to know the direction of the market in advance. Good luck with that! Second best is planning what to look for and how to react. That is the purpose of considering possible themes for the week ahead.
This Week’s Theme
We can expect a normal flow of economic data this week, featuring key reports on housing, the FOMC minutes, and the monthly inflation reports. The backdrop for this news includes four additional factors:
- Daily discussion of the continuing decline in energy prices;
- The year-end quest for big gains to meet performance benchmarks;
- Continuing skepticism for the most hated stock market rally; and
- The upcoming OPEC meeting – not until November 27th, but close enough for plenty of discussion.
From this combination I expect many to ask whether it is (finally) time to buy commodities. Here are some key viewpoints:
- The commodity “supercycle” has ended, dampening gold and oil prices for the next decade. Howard Gold at MarketWatch explores the underlying factors. (See also Mike Bird at BI.)
- Cold weather. This may provide a trading bottom, but not a long-term trend change. Cam Hui provides a detailed discussion with plenty of charts.
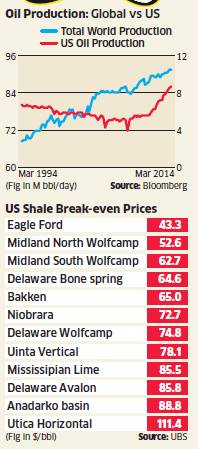
- Supply constraints will hit as prices fall. The Economic Times reports some interesting data, including this chart:
- The bottom is in. Energy fund manager Tim Guinness opined (two weeks ago) that oil prices might move lower, but the stock prices had already overcorrected.
- Energy earnings revisions have halted the downward slide (Brian Gilmartin).
- A look ahead to the OPEC meeting. Have the Saudi’s been posturing for a better negotiating position? (Daily Reckoning)
Before turning to my own conclusions, let us do our regular update of the last week’s news and data. Readers, especially those new to this series, will benefit from reading the background information.
Last Week’s Data
Each week I break down events into good and bad. Often there is “ugly” and on rare occasion something really good. My working definition of “good” has two components:
- The news is market-friendly. Our personal policy preferences are not relevant for this test. And especially – no politics.
- It is better than expectations.
The Good
The news last week was mostly good, even better than stock prices suggested.
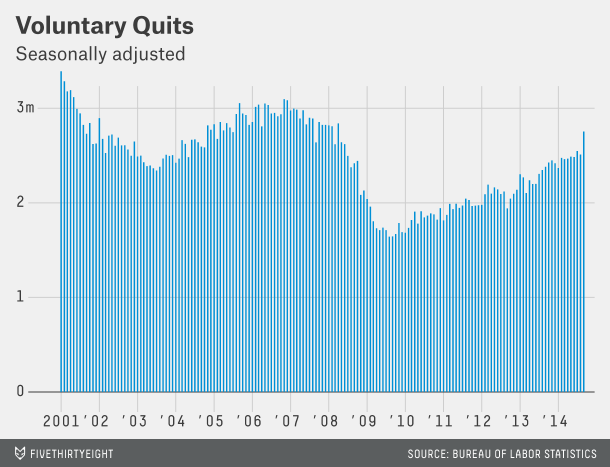
- The employment quit rate has increased dramatically. For years I have encouraged readers to ignore those who tried to use the JOLTs report (labor turnover) as a back-door method for estimating job growth. It is inferior for that purpose, but better at analyzing structural employment issues. If you want to look at overall economic health, the quit rate is a solid indicator. Fivethirtyeight (see strong and similar analysis and chart from Business Insider) has strong analysis and a helpful chart:
The rising number of quits is good news for several reasons. It’s a sign of confidence. Quitting your job almost always entails some risk, even if you have a new one lined up, so workers’ increasing willingness to do so suggests they think the job market is getting better. Changing jobs is also an important source of wage growth, particularly for younger workers. And job turnover of all kinds acts as a kind of lubricant in the job market, as employees who leave jobs create opportunities for others.
- The technical market prospects are encouraging. Charles Kirk’s weekly chart show and magazine are always part of my preparation for the week ahead. (Individual traders and investors will quickly earn back the modest subscription fee). Charles provides his typical detailed discussion – this time highlighting bullish targets achieved and the remaining setups.
- Gas prices declined another nickel. Doug Short provides his regular update with both analysis and charts.
- The Keystone pipeline is moving forward quickly. I expected approval in the next Congress, but it might come much sooner. Democrats are moving to help Sen. Landrieu’s Louisiana runoff election, something that happens more easily when an eventual loss is expected anyway. The Hill has good coverage, including this story.
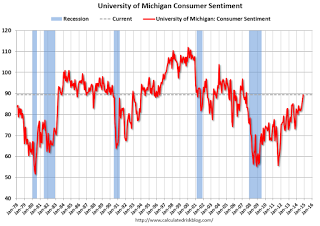
- Michigan sentiment set a new recent high of 89.4, best since 2007. This series correlates with employment, spending and stock prices, so it is worth watching. (See Calculated Risk).
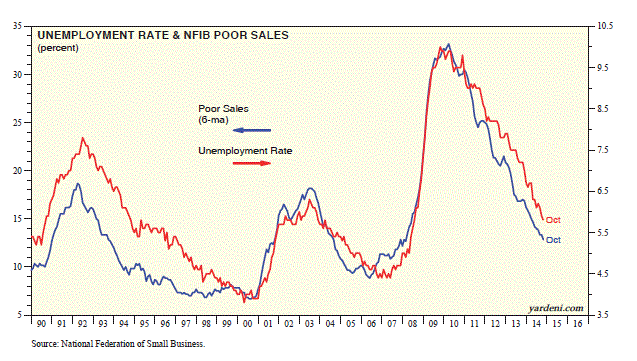
- Small business optimism is up. Reports of poor sales are lower and employment is better. Ed Yardeni has the story, including this chart:
- Retail sales, up 0.3%, beat expectations. (See Calculated Risk for charts and analysis).
The Bad
There was not very much bad news. Readers are invited to nominate ideas in the comments, but remember that we are focusing on recent developments, not a list of continuing macro concerns.
- Congress returns. The “lame duck” session has started and so has the rhetoric. Just last week it seemed like market unfriendly moves like a government shutdown would be avoided. Now it is already being threatened if Obama moves unilaterally on immigration. (The Hill)
- Ukraine fighting resumes. The cease fire has broken down. G20 leaders are threatening Putin with additional sanctions.
- Rail traffic shows slowing growth – a “soft period” according to the analysis at GEI.
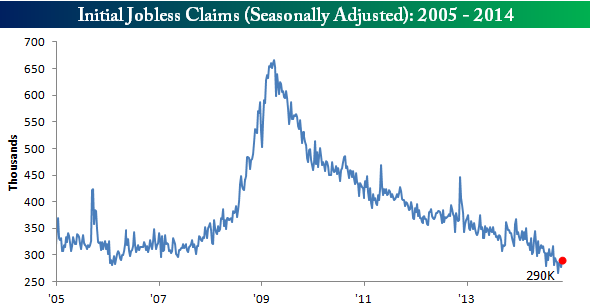
- Initial jobless claims increased by 12K, missing expectations. Bespoke’s analysis provides some long-term perspective.
Noteworthy
PIMCO compensation. $290 million for Bill Gross, as his fund lagged and he was leaving? Nearly as much for Mohamed El-Erian? Barry Ritholtz reveals the numbers. Eye-popping compensation hits many hot buttons these days. PIMCO says the numbers are wrong, but does not provide a correction. Michael Aneiro has an interesting summary of the discussion, including some other takes.
The Ugly
Chicago School District loans. They decided to embrace various Wall Street opportunities to reduce interest payments. They engage in Auction Rate Securities and various interest rate swaps. Here is the key quote from the widely quoted Chicago Tribune series:
No other school district in the country came close to CPS in relying so heavily on this exotic financial product. In fact, market data show the district issued more auction-rate bonds than most cities, more than the state of California.
But the bold move disregarded an iron law of finance: Nothing is free. If money is offered at a lower price, it means there are associated risks — risks the district could ill afford to take.
It is easy to use hindsight to criticize those who tried to save money for the school district. They were not stupid people, as the series makes clear. It has an eerie echo to what many individual investors are doing right now — reaching for yield without grasping the risks.
The Silver Bullet
I occasionally give the Silver Bullet award to someone who takes up an unpopular or thankless cause, doing the real work to demonstrate the facts. Think of The Lone Ranger.
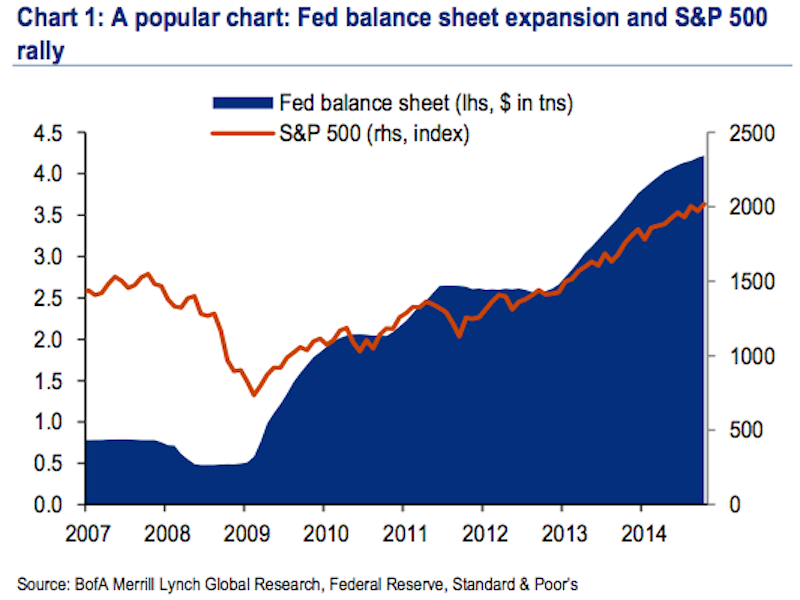
This week’s award goes to Merrill Lynch economist Ethan Harris for his explanation of another of those misleading charts that just won’t die: QE and stock prices. Here is his version of the chart in question.
And here is part of his explanation (via Myles Udland and BI):
“Every time the end of a QE program looms, pundits warn of a big shock to markets and the economy. In the business press, the story of exactly how this happens keeps shifting to fit the facts.”
The main target of Harris’ critique is the above chart, which has been a favorite among the “QE-truthers,” or folks who believe the Fed’s policies are directly responsible for the rise in the stock market.
But the big problem Harris has with this chart is, well, basic statistics.
“Implicitly, this chart assumes that the markets are not forward looking and it is the implementation of Q that drives the stock market: when the Fed buys, the market booms and when it stops, the market swoons,” Harris wrote.
“As our readers know, we think this relationship is a classic case of spurious correlation: anything that trended higher over the last 5 years has a 90%-plus correlation with the Fed’s balance sheet.”
Quant Corner
Whether a trader or an investor, you need to understand risk. I monitor many quantitative reports and highlight the best methods in this weekly update. For more information on each source, check here.
Recent Expert Commentary on Recession Odds and Market Trends
Doug Short: An update of the regular ECRI analysis with a good history, commentary, detailed analysis and charts. If you are still listening to the ECRI (three years after their recession call), you should be reading this carefully. This week there is (yet another) change in the ECRI story. See also his regular updates to the “Big Four” economic indicators important for official recession dating.
RecessionAlert: A variety of strong quantitative indicators for both economic and market analysis. While we feature the recession analysis, Dwaine also has a number of interesting market indicators.
Georg Vrba: has developed an array of interesting systems. Check out his site for the full story. We especially like his unemployment rate recession indicator, confirming that there is no recession signal. Georg’s BCI index also shows no recession in sight. Georg continues to develop new tools for market analysis and timing. Some investors will be interested in his recommendations for dynamic asset allocation of Vanguard funds. Georg has a new method for TIAA-CREF asset allocation. I am following his results and methods with great interest.
Bob Dieli does a monthly update (subscription required) after the employment report and also a monthly overview analysis. He follows many concurrent indicators to supplement our featured “C Score.”
We are fans of The Bonddad Blog, so we always read Hale Stewart’s commentaries. He is concerned about the prospects for a global recession – more so than our other sources. He sees some negative leading indicators from several countries and provides interesting charts. Take a look.
There was plenty of buzz about the “predictors of the ’29 crash” putting current recession odds at 65%. Usually the high-profile predictions of this sort lack any sort of track record and/or rely on over-fitting historical data. This one seemed to have a better pedigree until Barry Ritholtz took a deeper look. The prediction is not by the same person (Jerome Levy) or even the same firm. Barry’s article will provide a chuckle as well as a better perspective on several recent forecasts. Here is a taste:
Based upon some of the other forecasts of Levy the Younger, I can safely declare: No, there is not a gene for forecasting.
He goes on to note a similar Levy forecast four years ago and another at almost the bottom of the market in 2009.
The Week Ahead
We have a pretty normal week for economic data, with an emphasis on housing.
The “A List” includes the following:
- Initial jobless claims (Th). The best concurrent news on employment trends, with emphasis on job losses.
- Housing starts and building permits (W). So few understand that this is “upside risk.” Expectations remain low.
- Leading indicators (Th). This is still a widely followed series, despite some changes in the methods.
- FOMC minutes (W). Can there be anything else to glean from the Fed meeting? Pundits will try!
The “B List” includes the following:
- Existing home sales (Th). A good read on the current housing market, but less economic impact than new construction.
- Industrial production (M). Useful read on manufacturing. No weather effect for a change.
- PPI (T). Inflation is still not important – yet.
- CPI (W). See PPI above.
As usual, I do not care about the regional Fed reports. There is plenty of Fedspeak on tap, in addition to the minutes. Earnings are winding down. The big source for a surprise might be progress in the Ukraine conflict, where a worst case now seems to be reflected in the market.
How to Use the Weekly Data Updates
In the WTWA series I try to share what I am thinking as I prepare for the coming week. I write each post as if I were speaking directly to one of my clients. Each client is different, so I have five different programs ranging from very conservative bond ladders to very aggressive trading programs. It is not a “one size fits all” approach.
To get the maximum benefit from my updates you need to have a self-assessment of your objectives. Are you most interested in preserving wealth? Or like most of us, do you still need to create wealth? How much risk is right for your temperament and circumstances?
My weekly insights often suggest a different course of action depending upon your objectives and time frames. They also accurately describe what I am doing in the programs I manage.
Insight for Traders
Felix continued the profitable bullish posture. There is excellent breadth among the strongest sectors and very high ratings. Felix does not anticipate tops and bottoms, but responds pretty quickly when there is evidence of a change. The penalty box can be triggered by extremely high volatility and volume. It is similar to a trading stop, but not based only on price. This came into play about three weeks ago when we ended the inverse holdings and moved to partial long positions. The trading accounts have been fully invested since then.
The easiest trade of the week was advertised in advance. Herb Greenberg had a rare stock endorsement. The stock price ran up a bit before the on-air appearance and made another big spike as he presented—as huge opportunity. I do not do a lot of “trading tweets” but no one else seemed to notice this, so I sent out this chart:
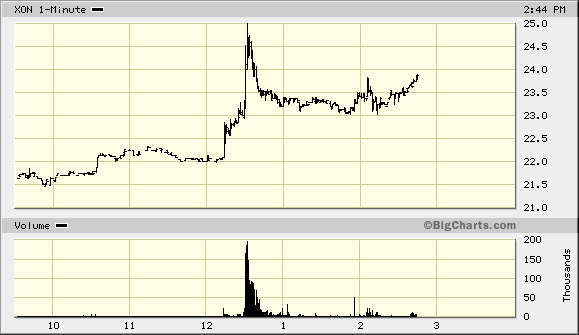
The “Greenberg Effect” was pretty obvious and the on-air gang, as usual, noted their market impact during the show. Herb made an accurate and polite reply to my tweet:
“they guessed when I tweeted i was going to talk positively about a stock. Reality Check readers read my piece month ago and when cnbc teased “biotech” it was a no brainier!”
I responded that this was fair enough, and an opportunity open to all. Traders watching the teases for the upcoming segments on CNBC have an opportunity. (Greenberg is leaving TheStreet.com to join a short-oriented institutional research firm. Best of luck to him!)
You can sign up for Felix’s weekly ratings updates via email to etf at newarc dot com. Felix also makes a daily afternoon appearance at Scutify.
Insight for Investors
I review the themes here each week and refresh when needed. For investors, as we would expect, the key ideas may stay on the list longer than the updates for traders. The recent “actionable investment advice” is summarized here.
Whenever there is a market decline, we are bombarded with “explanations” and predictions of disaster. To keep perspective I wrote a section recently covering these three points:
- What is not happening;
- Factors most often linked to major market moves; and
- The best strategy for the current market.
If you missed this section from a few weeks ago, I urge you to check out the Investor Section of the earlier WTWA.
Taking advantage of what the market is giving you is always a good strategy.
Other Advice
Here is our collection of great investor advice for this week:
Stock ideas! The very hot biotech sector has pulled back a bit. (For traders, Felix actually has it as one of the few sectors that is not worth a “fresh money” buy on the three-week time horizon). Fair enough. Investors should look for great entry points, but the issues are a bit different because of the potential gain. Investors do not want to miss out on a big move.
In our relatively new (one year) High Octane program we seek out stocks with exceptional potential and accept a higher level of volatility. Biotech is one of the various themes, and the Medical Technology Stock Letter is a source we follow closely. It has helped us into two big biotech winners this year (PCYC and ISIS) and there is a new recommendation related to Ebola. I have written about this threat for many months and the fluctuations in the “Ebola stocks” have been dramatic. Does anyone think we have reached the end of this story? I like the idea of a vaccine, and NVAX is the leader. Thanks to John McCamant for sharing a free report with our readers, including this:
The bottom line is NVAX’s proprietary platform allows the company to quickly develop, and manufacture a vaccine candidate at large scale in order to respond to emerging viral threats in an extremely efficient and effective manner.
Switching to value investing, Chuck Carnevale delivers another great installment. Value investors who focus too much on short-term results can easily lose patience – the path to failure. You need to have a method, have confidence, and stick to it. Chuck explains the need for patience, including specific suggestions and charts. (We have joined him in owning TUP, dragged down by some other names that are not really related).
Dividend and buyback stocks – from Goldman via Business Insider. Defense, health, and technology lead the list.
Danger! Professional advisors monitor breaking news on threats to investors. Individual investors can do the same if you know where to look. ThinkAdvisor has this list of the Top 9 Investor Threats for 2015. Pot stocks and fracking names are both on the list.
Barron’s warns that your high-yield mutual fund may include a big bet on energy stocks. These holdings have become a larger portion of many funds, and include some more speculative holdings:
“In high-yield bonds, significant new investments have been made in shale gas and oil investments,” writes Jeffrey Rosenberg, BlackRock’s chief fixed-income investment strategist. “Such growth in investments, fueled by debt and reflected in the significant rise in the energy-sector weightings, as well as the number of new issuers, could represent significant sources of future risk.” He says such risk depends on where oil prices ultimately stabilize.
In our programs we do not have any junk bonds in the bond ladders. I also prefer to select they type and level of energy investments with individual stocks, which may offer a reward more commensurate with the risks. Many yield-oriented investors do not look carefully enough at what they are buying.
Market Outlook. With so many dire warnings, a little balance may be helpful. Tony Dwyer explains (CNBC video) why he is not lowering his year-end target for the S&P 500. He uses a multiple of 19, earnings of 117.50 for a year-end target of 2230. Dwyer notes that Fed action typically represents only the first half of a rally, so there is more room to run.
Methods. Cullen Roche has a strong and appropriate message for many who have lagged the market: The Fed is not the reason you’ve been wrong. Please read his analysis of fundamentals. Instead of complaining about the Fed, it is better to anticipate policy changes and adapt appropriately. The best way to do that is to follow Fed expert Tim Duy, who interprets the latest Fed speeches and the timetable for rate increases.
Final Thought
It may not be the exact bottom for energy stocks, but they are among the cheapest on a P/E basis. There is a lot of bad future news in current commodity prices, so the risk/reward balance has shifted. Eddy Elfenbein notes that the declining energy prices have helped consumers, accompanying a four-week increase in global market value of a “staggering $3.4 trillion.” Josh Brown also emphasizes the Wall Street/Main Street tradeoff from the decline in energy stocks.
Many seem to start with the commodity prices and infer future economic weakness. This method is unreliable with a lot of false signals. I prefer to begin with economic data and then find the most attractive stocks. I provide more detail in Circular Reasoning about Commodities, including why I favor ESV and FCX.

