This coming week, the calendar is dealing us a light week for economic news and data. This usually opens the field for Pundits on Parade!
With markets at fresh highs and the calendar winding down, I expect this question:
Is it too late to join the stock market rally?
Prior Theme Recap
In my last WTWA I predicted that we would be asking about how to invest in a post-QE world. There was plenty of that discussion, including a CNBC employment report preview about the absence of the “F word!” It was not the main theme last week. Everyone tried to milk financial news from the election, even though there was little to glean. CNBC bailed out on election-night coverage (See criticism from Jeff Reeves via Chris Roush at Talking Biz News, a favorite source). They made up for it with incessant stories over the next two days. More on that below. I will accept this as an end to my hot streak in guessing the theme.
Feel free to join in my exercise in thinking about the upcoming theme. We would all like to know the direction of the market in advance. Good luck with that! Second best is planning what to look for and how to react. That is the purpose of considering possible themes for the week ahead.
This Week’s Theme
Whenever there is a pause in the flow of economic news there is extra emphasis on the perpetual market debate. Pages and air time must still be filled, and there is no shortage of opinion. I expect a popular theme to be whether it is “too late” for sidelined investors to buy stocks. Here are some key viewpoints:
- It is a mistake to buy stocks “up here.” This is often presented as an argument from a technical analysis perspective and/or a historical comparison.
- Stocks are over-valued, possibly in potential crash territory. (See anything from John Hussman, including the most recent take).
- Stocks have beaten bonds throughout history, especially for longer holding periods. Josh Brown uses Jeremy Siegel’s data for a “thirty second course” on asset allocation.
- Don’t wait for the “fat pitch.” Michael Batnick reviews ten years of reasons for not investing. Read the list to see if any seem familiar. Currently? Here is the current year comment and also his conclusion:
2014- “I’m gonna wait for the geopolitical risks to settle down. I also want to wait and see what will happen after the taper.”
My favorite Buffett quote and the one I think is the most relevant for the average investor is “so if you wait for the robins, spring will be over.” Buffett wrote this in his “Buy American. I am.” Op-ed in the New york Times in 2008. Don’t wait for the fat pitch and don’t wait for the robins because like Nick Murray said, “If you think the market is too high, wait until you see it twenty years from now.”
There is plenty of ammunition for the dueling pundits.
Before turning to my own conclusions, let us do our regular update of the last week’s news and data. Readers, especially those new to this series, will benefit from reading the background information.
Last Week’s Data
Each week I break down events into good and bad. Often there is “ugly” and on rare occasion something really good. My working definition of “good” has two components:
- The news is market-friendly. Our personal policy preferences are not relevant for this test. And especially – no politics.
- It is better than expectations.
The Good
There was plenty of news both ways, but it was mostly good.
- Election 2014. I am scoring this as “good news” not from cheering the outcome, but strictly from the market perspective. Here are the positives:
- First and foremost, it is over! This means that we can have a brief respite from posturing, with potential for some needed compromises.
- Sen. McConnell, expected to take over as Majority Leader, stated that the GOP would neither shut down the government nor obstruct increases in the debt ceiling. If you remember what happened around these controversies in 2011, you will see why that is important.
- The Keystone Pipeline will get approved. While this is putatively an executive decision, the Obama Administration is about to get a serious nudge from a Republican Congress. Unlike some other issues, this one will have Democratic support making it close to veto-proof. (The Hill and National Journal).
- Employment Report. The easiest way to know that this was a good report was to watch CNBC’s Rick Santelli, the point man for bearish commentary on all things economic. He could not complain about seasonal adjustments, which actually depressed this report. Rex Nutting explains that it was the best October in history. He could not complain about the birth/death adjustment, which also leaned the other way. Those traditional themes were therefore ignored as he explained that the growth was “not enough.” I agree!
- The economists’ consensus in a nice piece from Sarah Portlock of the WSJ. “On the whole, a strong report.”
- The trend is better than expected. The Economist explains that payroll growth only needs to be 50 to 75 K to reduce unemployment. Many sources are using old and inaccurate numbers. They also explain that the trend in growth is accelerating.
But stepping back for a moment, today’s numbers are anything but boring. Demographic trends suggest that to keep up with the long-term underlying growth in the labour force, payrolls need only grow 50,000 to 60,000 per month, Morgan Stanley reckons. America has been consistently creating jobs at four times that rate this year. The steadiness of the gains – this is the 56th straight month of private sector job growth – belies the fact that they have also been accelerating. This year’s average of 228,000 is up from 194,000 in 2013 and 186,000 in 2012. That demonstrates increasing cyclical economic momentum. That is also evident in the unemployment rate which continued to drop in October, to 5.8%, another six-year low, from 5.9%. It has now fallen 1.4 points in the last year, one of the fastest 12-month drops in 30 years.
- The household report was even stronger. Justin Wolfers suggests doing an 80-20 blend of the two reports. His conclusion is one of pretty strong growth.
- Earnings continue to beat estimates at a strong pace, 70% according to FactSet.
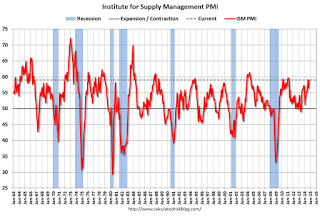
- ISM manufacturing beat expectations with an increase to 59.0. Calculated Risk has the story and this chart:
The Bad
There was not very much bad news. Readers are invited to nominate ideas in the comments, but remember that we are focusing on recent developments, not a list of continuing macro concerns.
- Putin. The rouble and the Russian economy are getting crushed. Pierre Briancon of Reuters explains as follows:
Capital is fleeing because Vladimir Putin’s policies have isolated Russia and killed optimists’ hopes of reforms. The Ukrainian crisis demonstrated the Russian president’s lack of interest in that agenda. Unreformed Russia is left ever more dependent on oil and gas exports while crude prices are at four-year lows. Russia will have to lean on this tottering wall until the Kremlin changes both foreign and economic policies.
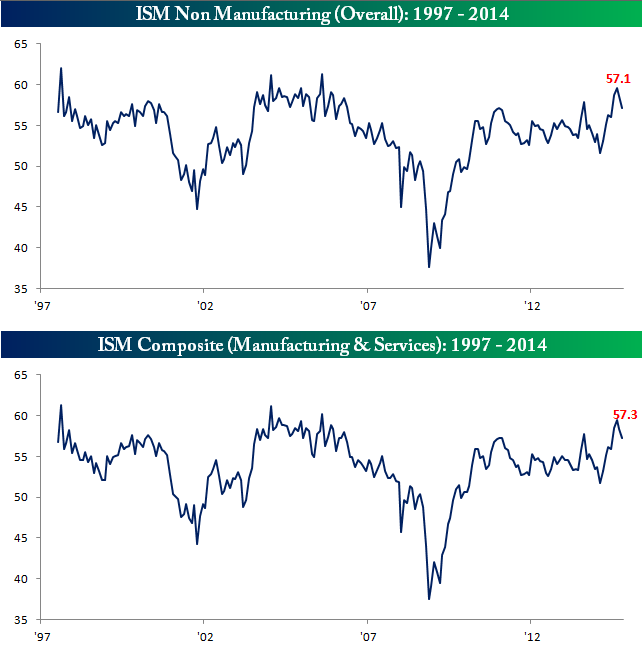
- ISM Services was weaker than expected. Bespoke’s great chart puts the data in context:
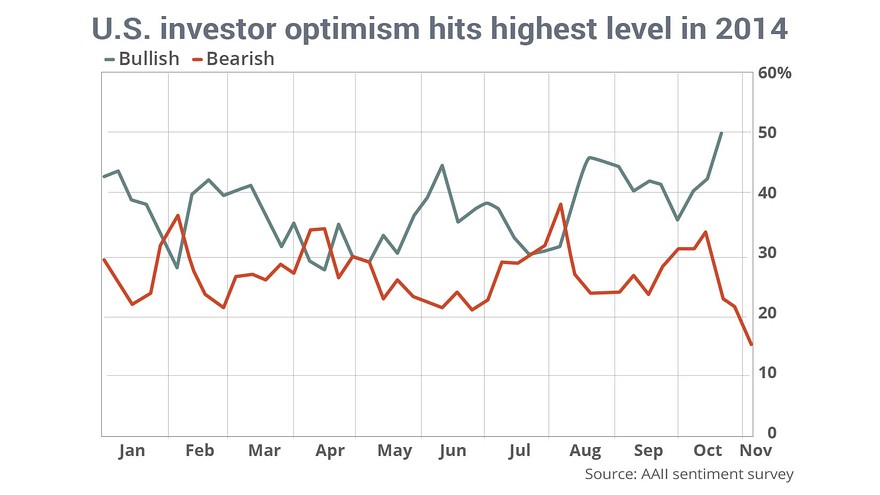
- Investor sentiment is at another high (AAII survey from MarketWatch). This is a negative on a contrarian basis. (Contra – Dr. Ed).
- Eurozone growth estimates were lowered due to Ukraine and Middle East effects. (WSJ). Germany is feeling the effects. (Credit Suisse). This despite the addition of sex and drugs to UK GDP, a boost of more than £10bn. (FT). (A little humor, OK?)
- Revenues in Q3 disappointed with a beat rate of only 40% (FactSet) and dragged down by energy (Brian Gilmartin).
- Trade deficit was wider. This will subtract a bit from Q3 GDP.
Noteworthy
Reuters has ended reader comments on news stories. There is a continual evolution in social media. The “thumbs up” method where you get a handful of votes out of 15-20,000 readers makes little sense. It also seems wrong to write a careful article and give a platform to an anonymous (and perhaps compensated) commenter. I know from experience how long it takes to offset inaccurate accusations from those on a mission. I really embrace good arguments and I try to accept even the overly zealous comments for at least one polite exchange. For those who are interested in page views the comment controversy is all good. The merits are irrelevant. That is what makes the Reuters decision interesting.
The Ugly
Student debt? I am raising the topic for consideration. Here is an aggressive portrayal, citing $100 billion of loans in default and making comparisons to subprime lending. The Brookings Institution draws a very different conclusion. Reuters also concludes that debt mostly falls on those with high incomes.
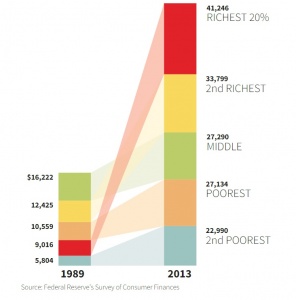
It is worth watching, but I dismiss the subprime comparisons until and unless Goldman Sachs creates a synthetic derivative on these loans!
The Silver Bullet
I occasionally give the Silver Bullet award to someone who takes up an unpopular or thankless cause, doing the real work to demonstrate the facts. Think of The Lone Ranger.
This week’s award goes to Floyd Norris of the New York Times. He takes on a very popular theme – government lying and cheating in data reports. This is so credible to the general public, where the perception of government is strongly linked to B-movies, that few even challenge the notion of misleading government data. If I had to pick a single mistake of the individual investor, this would be a strong contender. They are likely to believe that the President can call up the BLS and tell them what to report, or that the Fed buries certain results, silencing hundreds of employees, and misleads us all. Here is a key quote, possibly persuasive to those with an open mind:
The idea that politicians could force government bureaucrats to fake the statistics, and do so without any leaks, is hard to believe. Such a conspiracy, if it managed to exist for long, would be a marvel of organization. But those who believe in the conspiracy theory also tend to subscribe to the theory that governments are generally incompetent and unable to do anything right. Those two beliefs do not correspond.
Quant Corner
Whether a trader or an investor, you need to understand risk. I monitor many quantitative reports and highlight the best methods in this weekly update. For more information on each source, check here.
Recent Expert Commentary on Recession Odds and Market Trends
Doug Short: An update of the regular ECRI analysis with a good history, commentary, detailed analysis and charts. If you are still listening to the ECRI (three years after their recession call), you should be reading this carefully. This week there is (yet another) change in the ECRI story. See also his regular updates to the “Big Four” economic indicators important for official recession dating.
RecessionAlert: A variety of strong quantitative indicators for both economic and market analysis. While we feature the recession analysis, Dwaine also has a number of interesting market indicators.
Georg Vrba: has developed an array of interesting systems. Check out his site for the full story. We especially like his unemployment rate recession indicator, confirming that there is no recession signal. Georg’s BCI index also shows no recession in sight. Georg continues to develop new tools for market analysis and timing. Some investors will be interested in his recommendations for dynamic asset allocation of Vanguard funds. Georg has a new method for TIAA-CREF asset allocation. I am following his results and methods with great interest.
Bob Dieli does a monthly update (subscription required) after the employment report and also a monthly overview analysis. He follows many concurrent indicators to supplement our featured “C Score.”
The Week Ahead
We have a very light week for economic data.
The “A List” includes the following:
- Initial jobless claims (Th). The best concurrent news on employment trends, with emphasis on job losses.
- Michigan sentiment (F). Captures employment (including new jobs) as well as spending.
- Retail sales (F). Important and lagging economic element.
The “B List” includes the following:
- JOLTS (Th). The report on job openings is useful for analyzing structural unemployment. This is a key to the timing of interest rate hikes.
- Wholesale inventories (W). September data with implications for Q3 GDP.
There is a full slate of Fedspeak, including Chair Yellen on Thursday.
How to Use the Weekly Data Updates
In the WTWA series I try to share what I am thinking as I prepare for the coming week. I write each post as if I were speaking directly to one of my clients. Each client is different, so I have five different programs ranging from very conservative bond ladders to very aggressive trading programs. It is not a “one size fits all” approach.
To get the maximum benefit from my updates you need to have a self-assessment of your objectives. Are you most interested in preserving wealth? Or like most of us, do you still need to create wealth? How much risk is right for your temperament and circumstances?
My weekly insights often suggest a different course of action depending upon your objectives and time frames. They also accurately describe what I am doing in the programs I manage.
Insight for Traders
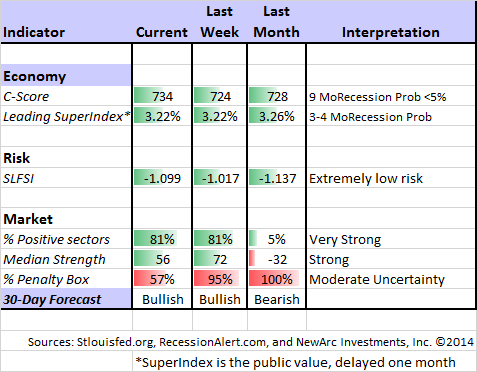
Felix continued the profitable bullish posture. There is excellent breadth among the strongest sectors and very high ratings. Felix does not anticipate tops and bottoms, but responds pretty quickly when there is evidence of a change. The penalty box can be triggered by extremely high volatility and volume. It is similar to a trading stop, but not based only on price. This came into play three weeks ago when we ended the inverse holdings and moved to partial long positions. The trading accounts have been fully invested.
Dr. Brett should be on the regular reading list for traders! This week he asks whether the stock rally is ready to roll over.
You can sign up for Felix’s weekly ratings updates via email to etf at newarc dot com. Felix also makes a daily afternoon appearance at Scutify.
Insight for Investors
I review the themes here each week and refresh when needed. For investors, as we would expect, the key ideas may stay on the list longer than the updates for traders. The recent “actionable investment advice” is summarized here.
Whenever there is a market decline, we are bombarded with “explanations” and predictions of disaster. To keep perspective I wrote a section recently covering these three points:
- What is not happening;
- Factors most often linked to major market moves; and
- The best strategy for the current market.
If you missed this section from a few weeks ago, I urge you to check out the Investor Section of the earlier WTWA. Taking advantage of what the market is giving you is always a good strategy.
Other Advice
Here is our collection of great investor advice for this week:
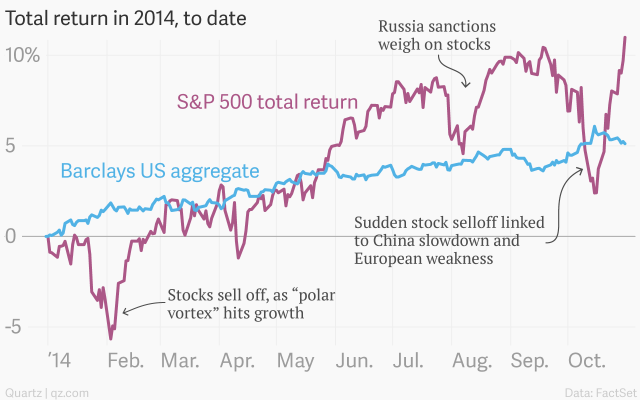
For 2014, stocks are back in the lead versus bonds. Like many other value investors, I expect this to continue for the immediate future, expecting actual losses from bond funds.
In yet another strong post, Michael Batnick explains the difference between being cautious and being bearish. Readers might want to provide their own examples of perma-bull behavior. Do any of the bulls really switch indicators as quickly and easily?
The thing about these perma-bears that makes my blood boil is that when they’re wrong they still win, it’s their investors who get burned. These people can stay wronger longer than you can stay solvent because they’ll collect their fees regardless of the outcome. The unfortunate reality is that the uninformed don’t know that this snake-oil salesman has called 14 out of the last 2 bear markets. The certainty with which these people deliver their message is amazing, they have been telling stories for so long they actually believe their own lies.
You might notice that these people are never wrong and the reasons why is an ever expanding list of nonsense. QE is bearish, nope, the end of QE is really bearish. Unsustainable high profit margins are bearish, low profit margins are also bearish. Oil prices falling are bearish because it is indicative of a slowing economy. High oil prices are even more bearish because it is a tax on consumers. You get the point.
These maniacs only exist to prey on the weak. People are always scared of the next shoe to drop so there will always be a mutual fund or separate account for bears. Fear is the easiest thing to sell, I can sell fear to the Grim Reaper.
On a seasonal basis, this is an “incredibly bullish” time to invest. Those who want to guess the timing of corrections or time the market should read Rob Hanna’s analysis and consider his data.
Beware of confusing skill and luck.
- Tadas Viskanta hits this point (among many other great ones) as he discusses how early luck can actually harm your investing or trading future. Those who join us in reading his work every day will appreciate this interview.
- Michael Mauboissin’s efforts to distinguish between skill and luck are summarized in this post from Boyles Asset Management. Few investors understand that the investing process is a much better indication of future success than short term returns. (The author suggests that five years is a good starting point).

If you are stuck in gold, you might consult about some good alternatives. If you are out of the market completely, you might want to reconsider your approach. The current economic cycle is in the fifth inning. This is one of the problems where we can help. It is possible to get reasonable returns while controlling risk. You can get our report package with a simple email request to main at newarc dot com. Also check out our recent recommendations in our new investor resource page — a starting point for the long-term investor. (Comments and suggestions welcome. I am trying to be helpful and I love and use feedback).
Final Thought
We are all slaves to the calendar. Why focus on year-end predictions? It is much better to update your price targets on a regular basis, making use of new evidence. I am encouraged by three factors:
- There is little near-term risk of recession, the source of the most costly market declines.
- As always, there is a list of known risks. This is essential to progress as I explained in my Dow 20K thesis (written at Dow 10K).
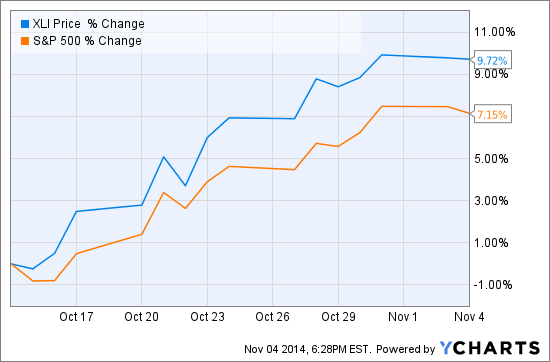
- The market is responding to good economic news, and there is still plenty of room for improvement. (See Carla Fried at YCharts, which we use regularly for both testing and ideas). One of the charts from this helpful article shows the outperformance of cyclical stocks during the recent rebound.
