Despite a full slate of data, continuing international events, Washington maneuvering, and a possible record in Fed speeches, a new subject will command attention this week:
Will there be an earnings recession, and should we worry?
Prior Theme Recap
In my last WTWA I predicted that attention would focus on reasons behind the recent stock market volatility. That was a good guess. CNBC stayed with that theme late in the week as volatility dwindled. Steve Liesman even asked NY Fed President Dudley about the Fed role. His answer? Volatility was caused by world circumstances and the nature of the decision, not Fed policy or messaging. Most of the trading community was blaming the Fed anyway. To get the full weekly story, let us look at Doug Short’s weekly chart. This one saves more than a thousand words! (With the ever-increasing effects from foreign markets, you should also add Doug’s World Markets Weekend Update to your reading list).
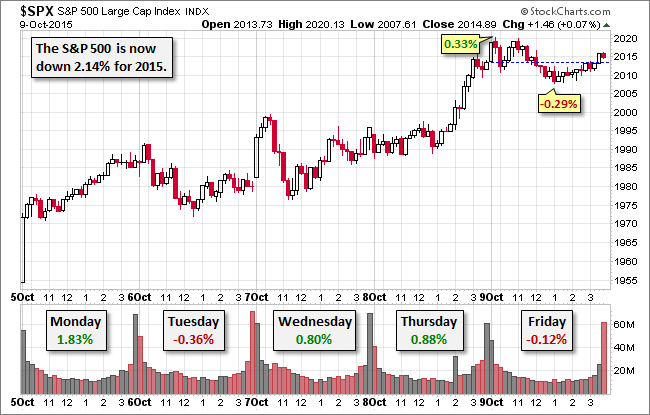
While I naturally take a week-by-week approach, Doug’s update provides multi-year context. See his full post for more excellent charts and analysis.
We would all like to know the direction of the market in advance. Good luck with that! Second best is planning what to look for and how to react. That is the purpose of considering possible themes for the week ahead. You can make your own predictions in the comments.
This Week’s Theme
Despite the economic data and non-stop Fed chatter, the coming week will focus on earnings. In particular, there is the chance that year-over-year S&P 500 earnings will decline for the second consecutive quarter. Because of the two-quarter angle, some cite this as an earnings recession. I expect the pundits to be asking:
Will there be an earnings recession? And does it matter for stocks?
As always, the viewpoints are varied. I will emphasize the main ideas in this list, but there are plenty of gradations.
- The earnings decline is serious and might imply an economic recession. The two are often “associated” in time.
- Earnings will decline but it is temporary and not indicative of an economic recession.
- The earnings recession is focused on energy and materials. Both are improving.
- Earnings reports and estimates are firming.
- The 2016 outlook is more positive.
Preview Material
To get ready for earnings season, it helps to have background facts. FactSet’s data shows a current forecast of a 5.5% decline for the quarter versus last year. Allowing for the gaming of 'lower the bar' to help beat estimates, the decline might be much smaller. We might even avoid the technical earnings recession. It is also possible that full 2015 earnings will show a decline.
Brian Gilmartin notes the poor earnings results from last week, and asks the right questions about energy and China. The energy effect is not close to a conclusion, as this table shows:
- Q2 ’14: +17%
- Q3 ’14: +10.3%
- Q4 ’14: -21.8%
- Q1 ’15: -57.9%
- Q2 ’15: -56.4%
- Q3 ’15: -64.6% (est)
- Q4 ’15: -63% (est)
- Q1 ’16: -23.8% (est)
- Q2 ’16 -12.3% (est)
- Q3 ’16: +25% (est)
Brian’s Source: Thomson Reuters “This Week in Earnings” dated 10/9/2015
As always, I have my own ideas in today’s conclusion. But first, let us do our regular update of the last week’s news and data. Readers, especially those new to this series, will benefit from reading the background information.
Last Week’s Data
Each week I break down events into good and bad. Often there is “ugly” and on rare occasion something really good. My working definition of “good” has two components:
- The news is market-friendly. Our personal policy preferences are not relevant for this test. And especially – no politics.
- It is better than expectations.
The Good
There was not much economic data, but some of the news got a bullish interpretation from the market.
- FOMC minutes provided very little fresh information, but were viewed as slightly more dovish than the announcement, press conference, and a dozen or so speeches since the meeting. At least that was the explanation given for market wavering and then rallying less than one percent after the news. Sheesh.
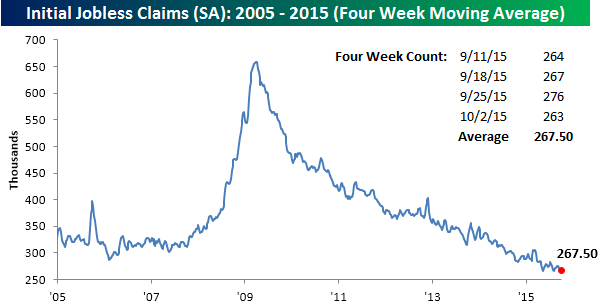
- Initial jobless claims declined to 263K. The four-week average also hit a new low. Bespoke has charts for all time frames, with and without seasonal adjustments.
- Technical setups and indicators have improved. Charles Kirk’s wonderful weekly magazine is always part of my preparation for WTWA. This week he mentions a number of different trading and technical links. Here are some interesting choices on a single theme.
- Rob Hanna notes the positive signal from the Zweig breadth index, with gains in all (seven) time periods since 1970 for a twenty day period.
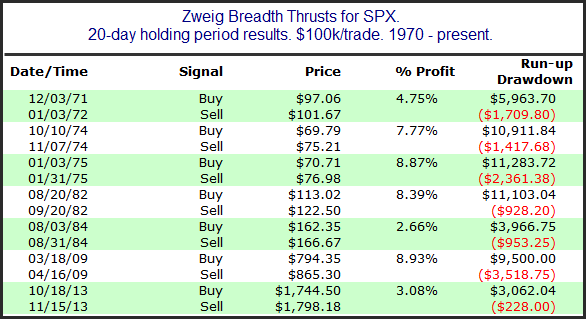
- Tom McClellan looks at the same data and remains skeptical.
- Cam Hui sees a strong buy signal.
- Eddy Elfenbein sees an “all clear” signal based on a lower VIX.
- Government shutdown averted– so far. Polls say that the average person does not care whom the GOP picks to be Speaker of the House. From the investment perspective it makes a difference. While commentators often opine that gridlock is OK, there are some big issues where compromise is necessary. (MarketWatch)
The Bad
There was also some negative data.
- The Chinese are “dumping” U.S. bonds according to the WSJ. Over the years there have been many scary stories about “who will buy our bonds” including a 2011 warning from Bill Gross. His piece has been pulled, but Cullen Roche analyzed it effectively at the time. As China’s trade balance changes, so will their holdings of foreign assets. These must eventually sum to “zero.” Meanwhile we have a story from another bond expert saying the opposite – that yields will plummet and prices fall.
- Rail traffic declined 2%. Steven Hansen at GEI has the story.
- U.S. trade deficit widened to $48.3B, more than expected and significantly higher than the last report of $41.8B. Despite the negative shift, which will probably hurt GDP, exports hit a new high and rising imports reflected a stronger dollar. These stories are difficult to interpret, but this WSJ article does a good job.
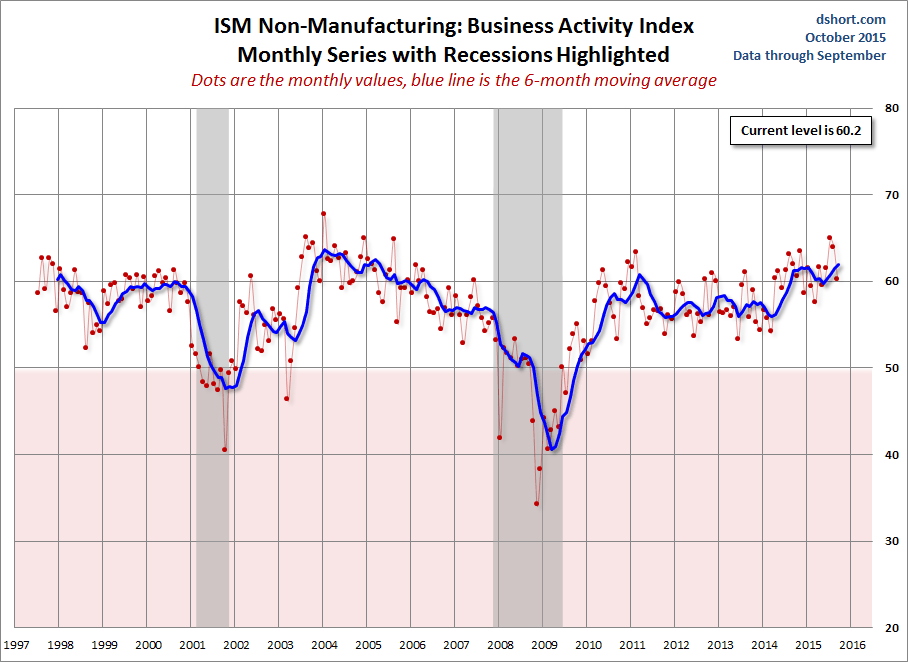
- ISM services came in a bit lighter than expectations at 56.9. Doug Short has a complete analysis with tables of internal changes and great charts.
The Ugly
Fast traders and Treasuries. A study by the NY Fed (Susanne Walker Barton has a nice summary for Bloomberg; original study here) found that fast traders submitting multiple orders confused other traders about the depth and liquidity of the market. The Treasury market is the deepest and most liquid of all, but the effects extend further:
The mirage arises because “market participants respond not only to news about fundamentals, but also market activity itself,” the researchers wrote. “This can lead to order placement and execution in one market affecting liquidity provision across related markets almost instantly.”
To think a little more about the possible implications, see the “Noteworthy” section below.
Noteworthy
Kevin Schaul at Wonkblog has an interesting puzzle that you will enjoy. He is illustrating one purpose, but readers of WTWA will quickly find other applications.
The problem starts with a fictional small town and a simple question: Will the town declare baseball caps to be fashionable? A polling firm asks people whether they thought the proposition would win. The blue dots are people who support the proposal and the lines reflect personal contacts. Based upon this information, what do you think the poll showed? (Go to the site for the full interactive experience).
When you have finished this exercise, you will see some market implications.
The Silver Bullet
I occasionally give the Silver Bullet award to someone who takes up an unpopular or thankless cause, doing the real work to demonstrate the facts. Think of The Lone Ranger. No award this week, despite the abundance of really bad analysis. I am thinking of starting a nominee section. This would include items that have obvious errors but which have not attracted any replies or refutation. Almost any two-variable chart these days is a candidate.
Quant Corner
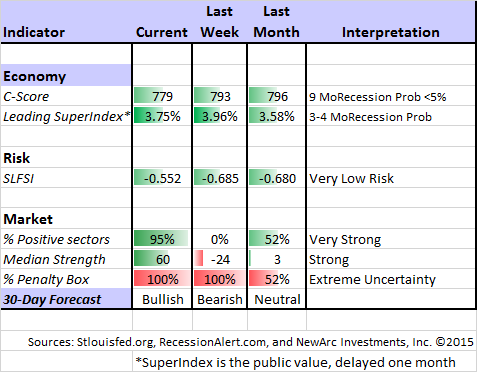
Whether a trader or an investor, you need to understand risk. I monitor many quantitative reports and highlight the best methods in this weekly update. For more information on each source, check here.
Recent Expert Commentary on Recession Odds and Market Trends
Bob Dieli does a monthly update (subscription required) after the employment report and also a monthly overview analysis. He follows many concurrent indicators to supplement our featured “C Score.”
RecessionAlert: A variety of strong quantitative indicators for both economic and market analysis. While we feature the recession analysis, Dwaine also has a number of interesting systems. These include approaches helpful in both economic and market timing. He has been very accurate in helping people to stay on the right side of the market.
Georg Vrba: An array of interesting systems. Check out his site for the full story. We especially like his unemployment rate recession indicator, confirming that there is no recession signal. He gets a similar result from the Business Cycle Indicator. Georg
Georg also analyzes the market after a “Death Cross” event – often a weaker market, but not a time to panic. His work was featured in this Seeking Alpha article.
Doug Short: Provides an array of important economic updates including the best charts around. One of these is monitoring the ECRI’s business cycle analysis, as he does in this week’s update. The ECRI’s most recent article includes their unique interpretation of the JOLTs report, and opines that there are job openings that will “never be filled.” Doug sees this as a “fascinating answer.” I see it as a continuation of a long-term excuse about not getting the story right on the economy. For starters, there are many sophisticated interpretations of the JOLTs report. The ECRI might try to publish their idea in a refereed journal to get some professional feedback. Hint: Include something about the Beveridge Curve.
The Week Ahead
It is a pretty normal week for economic data. While I highlight the most important items, you can get an excellent comprehensive listing at Investing.com. You can filter for country, type of report, and other factors.
The “A List” includes the following:
- Retail sales (W). Can the consumer strength continue?
- Michigan sentiment (F). Fewer jobs are being lost, but what about new ones? And consumer spending?
- Industrial production (F). This volatile series provides information not available elsewhere – worth watching.
- Initial jobless claims (Th). The best concurrent news on employment trends, with emphasis on job losses.
The “B List” includes the following:
- Beige book (W). Collection of anecdotal evidence for next FOMC meeting. Watch for China or currency references.
- JOLTS report (F). Getting respect as a measure of labor market structure. Job openings and quit rate are most interesting.
- PPI (W). Inflation is still not a threat, and this is not the most important indicator.
- CPI (Th). A little more important than PPI, but still not a major current interest.
- Philly Fed (Th). I remain skeptical of the real meaning from this, but a recent study says that it moves markets.
- Crude oil inventories (W). Current interest in energy keeps this on the list of items to watch.
There is an abundant calendar of Fed speeches to provide grist for the punditry. Most important, of course, will be earnings reports.
How to Use the Weekly Data Updates
In the WTWA series I try to share what I am thinking as I prepare for the coming week. I write each post as if I were speaking directly to one of my clients. Each client is different, so I have five different programs ranging from very conservative bond ladders to very aggressive trading programs. It is not a “one size fits all” approach.
To get the maximum benefit from my updates you need to have a self-assessment of your objectives. Are you most interested in preserving wealth? Or like most of us, do you still need to create wealth? How much risk is right for your temperament and circumstances?
My weekly insights often suggest a different course of action depending upon your objectives and time frames. They also accurately describe what I am doing in the programs I manage.
Insight for Traders
Felix has made a rapid shift to bullish, with positions reversing early in the week. I cannot remember or more rapid or dramatic switch, but many traders reacted to the major change in the markets. Felix has only partial positions since the penalty box indicator remains on full tilt. This means that things are difficult to predict. Stay small or not at all. For more information, I have posted a further description — Meet Felix and Oscar. You can sign up for Felix’s weekly ratings updates via email to etf at newarc dot com. Felix appears almost every day at Scutify (follow him here).
Tough decision? Ask what a professional trader would do? Also six deadly sins of amateurs. (Tradeciety).
Annie Duke discusses the similarities between poker and trading. Great stuff from Trend Following. Hint: Don’t focus on losses and go on “tilt.”
Insight for Investors
I review the themes here each week and refresh when needed. For investors, as we would expect, the key ideas may stay on the list longer than the updates for traders. Major market declines occur after business cycle peaks, sparked by severely declining earnings. Our methods are focused on limiting this risk. Start with our Tips for Individual Investors and follow the links.
We also have a page summarizing many of the current investor fears. If you read something scary, this is a good place to do some fact checking.
Other Advice
Here is our collection of great investor advice for this week.
If I had to pick a single most important article, it would be this short post by Ross Heart, who is inspired by a quote from Thoreau – “It’s not what you look at that matters, it’s what you see.” He writes:
Because of enormous computing power, an endless supply of commentators on the teevee, and a relentless barrage of internet pontificating, the quantity of what can be ‘looked at’ is infinite, and quite often paralyzing.
My own conclusion is that the avalanche of information has actually been costly to many investors and traders – preying upon their worst fears, creating emotional or political biases, and then cherry-picking data for confirmation. It is well worth thinking about.
Stock Ideas
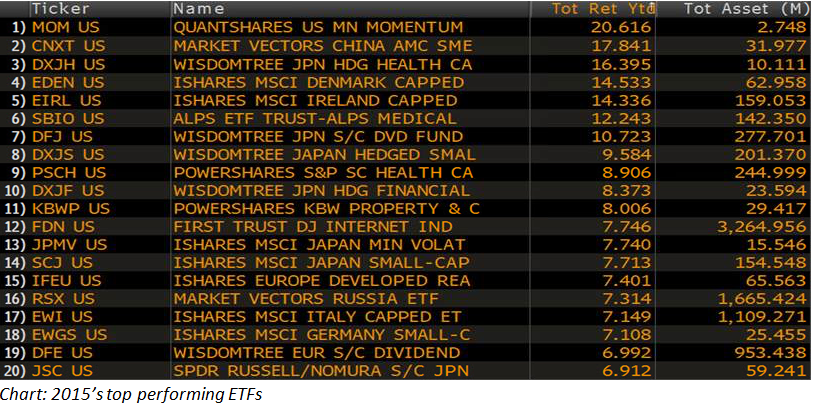
Only 10% of ETFs are up on the year, and you probably do not own the winners. This is an interesting list to consider, mostly to illustrate how micro-trends work for a while. (Eric Balchunas at Bloomberg).
Chuck Carnevale has a great list of attractive dividend growth stocks with a careful discussion of the rationale. As always, I recognize a number of the names from our own holdings.
The Value Investing Approach
Jae Jun has a nice account of investing principles from Guy Spier of the Aquamarine Fund. The ten points are useful for all value investors. Here is #5:
5. Play Center Court
Playing as close to the foul line as possible can bring great results and make you look like a genius.
But what happens if things change or things don’t go your way?
John Paulson made billions by betting correctly on subprime. He couldn’t simply go back to “normal” or “simple” investments after that.
Here’s what happened in the following years.
-52% in 2011
Lost more than -20% in 2012
Reports of strong returns in 2013
-36% in 2014
If we have a strength, it is in recognizing when we are operating well within our circle of competence and when we are approaching the perimeter. – Warren Buffett
Personal Finance
Professional investors and traders have been making Abnormal Returns a daily stop for over ten years. The average investor should make time (even if not able to read every day as I do) for a weekly trip on Wednesday. Tadas always has first-rate links for investors in this special edition. As always, there are several great links, but I especially liked this WSJ story about four things to do before retirement.
In case you hadn’t noticed – and despite official inflation reports – retiree health care costs are rising. They are now estimated at $250,000.
Market Outlook
Bill Gross sees a 10% stock decline and urges a move to cash. (Bloomberg)
Scott Grannis remains optimistic, partly because the wall of worry is intact.
Watch out for…
Doomsters
Barry Ritholtz has a great article explaining why as an investor you should ignore those end of the world predictions. He cites several past examples, including last week’s October 7th forecast. The best reason is explained in a classic Art Cashin story.
Commodity Futures
Alpha Architect analyzes the many possible pitfalls. Key point: It is not the same as investing in related stocks.
Final Thought
The investment climate, despite the recent rebound in stocks has four pillars of skepticism:
- The global economy – viewed as about to collapse into a recession. There were many stories on this theme last week, using whatever recession definitions were necessary to induce worry;
- Policy errors by central banks have created a decline that they are now powerless to halt;
- Earnings estimates are too high, despite recent reductions; and
- Earnings “quality” is low, suggesting that financial engineering rather than sales are behind whatever reports are positive.
With this in mind we know what to watch for in the coming season. A company must beat on earnings (perhaps a lowered bar), beat on revenues (also maybe reduced expectations), provide a promising outlook, and avoid saying anything about how China, emerging markets, or the stronger dollar affected their results!
A typical bad conference call would acknowledge something minor. “China is about 10% of our business and orders declined 5%. Visibility about future improvement is low.” Even though this is about 50 bps on revenue, it will lead to a 10% decline in the stock price. There will also be a lot of interest in companies that “pre-announced” that the China business was OK.
As always, the quarterly earnings reports provide some help on the valuation debate. I predict that you will struggle to find even one earnings analysis that refers to the Tobin’s Q for a stock or the impact of the report on the Shiller CAPE measure. If I am wrong, please submit reports. If I am right, the disciples of these methods need to ask why they are allegedly so accurate for the overall market when not relevant for any single stock.
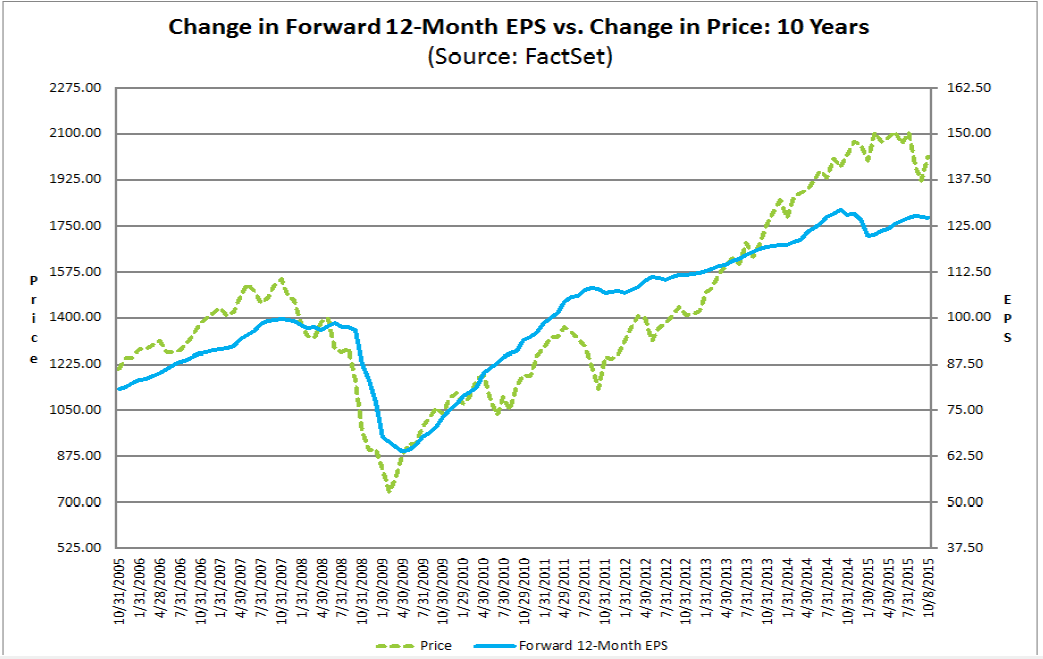
I expect many to be looking ahead to 2016 earnings. This helps to explain why forward earnings estimate remain important, as illustrated by FactSet.
