This week’s economic news is mostly jobs-related. The Fed has cited employment as the most important factor in future rate decisions. There is plenty of FedSpeak on tap. Pundits love to talk about the Fed. Voila! The theme for the week will combine all of these elements:
Can the employment news change the Fed’s course?
Prior Theme Recap
In my last WTWA I predicted that attention will focus on markets rather than the economic reports. In particular, I suggested several different viewpoints about expected market action. While each of these got a riff or two during the week, I was expecting the main theme to be the challenge to the top of the trading range. With the soft start to the week, the upside breakout potential got little attention.
Feel free to join in my exercise in thinking about the upcoming theme. We would all like to know the direction of the market in advance. Good luck with that! Second best is planning what to look for and how to react. That is the purpose of considering possible themes for the week ahead.
This Week’s Theme
This week’s economic news is mostly about employment. At week’s end we will get the monthly employment situation report, with plenty of angles and spin potential. In addition we will see the ADP private employment report, news about layoffs, initial jobless claims, and a report on service sector employment. The Fed is giving special attention to employment, watching for signs that the labor market is getting tight and wage pressures mounting. This week I expect discussion to center on employment and the aftermath of last week’s FOMC rate meeting. Fed speakers will be out all week, discussing the data and answering questions. Analysts will be asking:
Can the employment data change the Fed’s course?
The Viewpoints
Fed policy is a favorite market topic, eliciting a range of viewpoints encompassing both economic prospects and prospective rate tightening. Here are the leading candidates:
- The economy remains very weak, so the Fed is on hold. (Numerous super-bears).
- The economy remains sluggish, but the Fed will begin a modest rate increase program nonetheless. (Tim Duy).
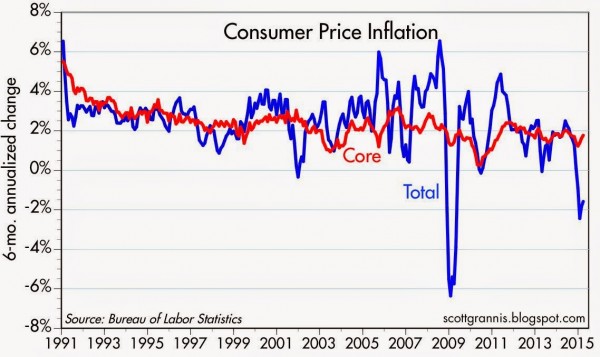
- There are already signs of inflation and the Fed will begin rate increases by September. (Scott Grannis)
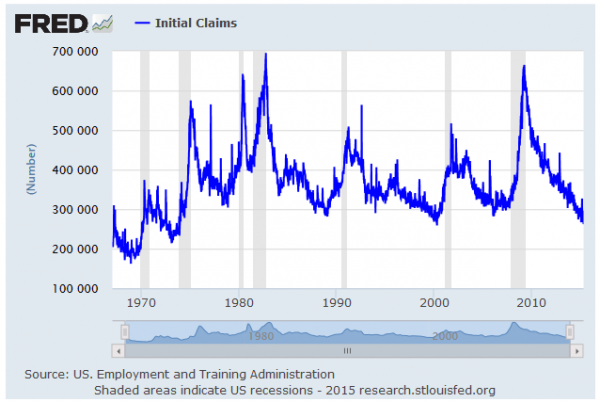
- Labor markets are tighter, even though the overall economy is weak. (Eddy Elfenbein – initial claims 2nd lowest since 1973).
- The Fed is already hopelessly “behind the curve” and must start tightening soon. (Martin Feldstein).
As always, I have my own ideas in today’s conclusion. But first, let us do our regular update of the last week’s news and data. Readers, especially those new to this series, will benefit from reading the background information.
Last Week’s Data
Each week I break down events into good and bad. Often there is “ugly” and on rare occasion something really good. My working definition of “good” has two components:
- The news is market-friendly. Our personal policy preferences are not relevant for this test. And especially – no politics.
- It is better than expectations.
The Good
There was some good news in a mixed week.
- Consumer spending rose 1.9%, confirming the early read from New Deal Democrat that we noted last week. See his post for these results and much more.
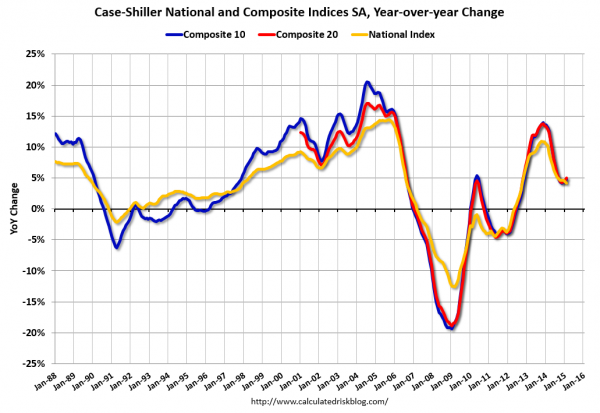
- Home prices showed a nice gain of 5% y-o-y according to the Case-Shiller method. (Calculated Risk).
- Initial jobless claims hit the lowest point since 2000, 262K.
The Bad
The news also included some negatives.
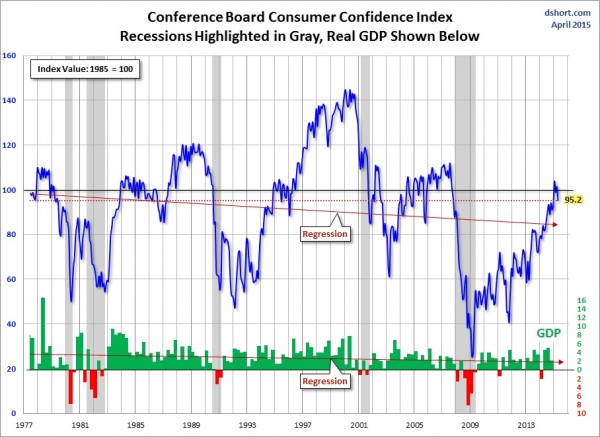
- Consumer confidence missed expectations on the Conference Board survey. Doug Short has a full account, including some negative quotations from the source. The article also covers and charts the Michigan Sentiment survey, which was a little more positive.
- Earnings reports tilted a bit negative in a complex story. 71% beat on earnings and only 46% on revenue. Both of these numbers are below average. When weighted by market cap, the earnings story is a bit better. The outlook stories still lean negative. See both FactSet and Brian Gilmartin for both data and analysis.
- Student loan defaults are even worse when viewed as a fraction of those actually expected to make current payments – over 30%. (WSJ).
- Q1 GDP was barely positive, showing a gain of only 0.2%. Conclusions about this weak report vary widely.
- The meager gains are to be expected in a new world of recessions. (ECRI).
- One-time factors explain much of the weakness (summarized with links by Mark Thoma).
- Seasonal factors take this down from a more accurate read of a 2% gain (Barron’s).
- Core GDP is a much better measure, focusing on the domestic economy and avoiding variation in exports and inventories. Bob Dieli’s reports are both witty and sophisticated. His analysis shows why the current weakness is not like the prior pre-recession bouts. He has agreed share this report with our audience. As a bonus, you will also learn Bob Uecker’s advice on how to catch a knuckleball!
The Ugly
Baltimore – sad in all respects.
The Silver Bullet
I occasionally give the Silver Bullet award to someone who takes up an unpopular or thankless cause, doing the real work to demonstrate the facts. Think of The Lone Ranger.
This week’s award goes to Barry Ritholtz for his analysis of margin debt. This is yet another measure that peaks coincident with or after new market highs. It is usually cited via an uncritical chart that does not show any leading quality, like this one modified from a more objective Doug Short analysis:
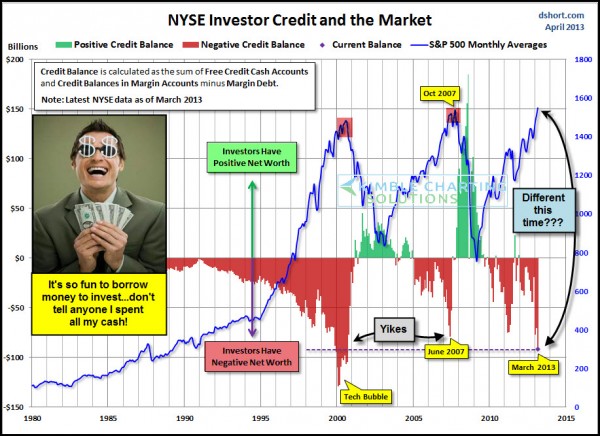
Barry concludes as follows:
Margin debt rises and falls with markets. The basis for making loans against equities naturally increases when the value of that portfolio goes up. Margin debt declines when the value of that underlying collateral goes down. No big surprise; that is how margin works.
However, it is a double-edged sword. It can help drive buying during a bull market; during a bear market it does the opposite, pushing prices lower. It gets ugly during a retreat, when falling equity prices lead to so-called margin calls and forced selling. The rules generally don’t permit margin debt to exceed 50 percent of the shares pledged as collateral.
So why don’t I consider margin debt a valid indicator? Because as markets reach new highs, so too does margin debt. As we have previously discussed, new highs are a good thing.
During a bull market, those new highs occur with regularity. As my colleague Josh Brown notes:
On a daily basis, the S&P 500 trades at an all-time high 7% of the time and trades within 5% of an all-time high 36% of the time. This means that on 43% of all days, since the S&P 500’s inception, US large cap stocks were at or close to making new records.
It should come as no surprise then that NYSE margin debt keeps rising.
Quant Corner
Whether a trader or an investor, you need to understand risk. I monitor many quantitative reports and highlight the best methods in this weekly update. For more information on each source, check here.
Recent Expert Commentary on Recession Odds and Market Trends
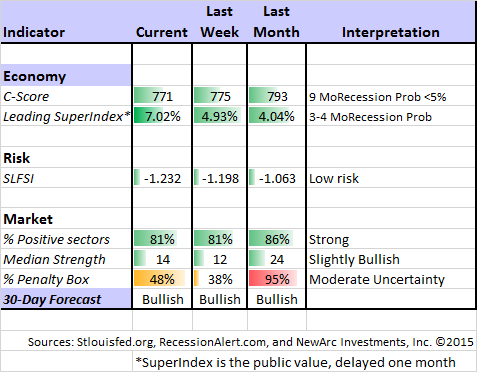
Bob Dieli does a monthly update (subscription required) after the employment report and also a monthly overview analysis. He follows many concurrent indicators to supplement our featured “C Score.”
RecessionAlert: A variety of strong quantitative indicators for both economic and market analysis. While we feature the recession analysis, Dwaine also has a number of interesting market indicators. He recently noted an increase in his combined measure of economic stress, although the levels are still not yet worrisome. Recently Dwaine introduced a valuation model that is much more sophisticated than the popular Shiller CAPE method. It also provides a much less worrisome conclusion, 13.7% returns through the end of 2016.
Georg Vrba: has developed an array of interesting systems. Check out his site for the full story. We especially like his unemployment rate recession indicator, confirming that there is no recession signal. He gets a similar result from the Business Cycle Indicator. Georg continues to develop new tools for market analysis and timing, including a combination of models to do gradual shifting to and from the S&P 500. I am following his results and methods with great interest. You should, too.
Doug Short: An update of the regular ECRI analysis with a good history, commentary, detailed analysis and charts. If you are still listening to the ECRI (three years after their recession call), you should be reading this carefully. Doug has the latest interviews as well as discussion. Also see Doug’s important Big Four summary of key indicators, updated regularly.
“Sell in May” gets more slicing and dicing. If you pick the right time period and the right number of months, you can make the data sing. Dana Lyons says May is the worst. Or maybe not, says Force Majeure.
The Week Ahead
There are fewer reports than usual this week, but some are very important.
The “A List” includes the following:
- The employment report (F). Despite the wide error range and many revisions, this remains the most important economic touchstone.
- ADP private employment (W). A good alternative read on changes in private employment.
- ISM services (T). Good concurrent read on service sector strength, with some leading components.
- Initial jobless claims (Th). The best concurrent news on employment trends, with emphasis on job losses.
The “B List” includes the following:
- Trade balance (T). March data will affect Q1 GDP revisions.
- Factory orders (M). Volatile March data.
- Crude oil inventories (W). Maintains recent interest and importance.
It is a big week for Fed speakers, including Chair Yellen. Expect also to hear more from former Chairman Bernanke.
Earnings season continues.
How to Use the Weekly Data Updates
In the WTWA series I try to share what I am thinking as I prepare for the coming week. I write each post as if I were speaking directly to one of my clients. Each client is different, so I have five different programs ranging from very conservative bond ladders to very aggressive trading programs. It is not a “one size fits all” approach.
To get the maximum benefit from my updates you need to have a self-assessment of your objectives. Are you most interested in preserving wealth? Or like most of us, do you still need to create wealth? How much risk is right for your temperament and circumstances?
My weekly insights often suggest a different course of action depending upon your objectives and time frames. They also accurately describe what I am doing in the programs I manage.
Insight for Traders
Felix continued a bullish stance for the three-week market forecast. The confidence in the forecast remains rather modest, reflected by the percentage of sectors in the penalty box. Our current position remains fully invested in three leading sectors. For more information, I have posted a further description — Meet Felix and Oscar. You can sign up for Felix’s weekly ratings updates via email to etf at newarc dot com. Felix appears almost every day at Scutify (follow him here).
We also have some exciting news about Oscar. Just like the revised TV show, we have updated Oscar to include a new and promising universe of trading targets. The results of this model (Felix logic but a new universe) are quite interesting. More soon.
Traders can start to plan for trading in weekly VIX options, maybe as soon as July. This will allow trades to be more closely calibrated to the timing of major data releases and Fed announcements. (Barron’s)
Insight for Investors
I review the themes here each week and refresh when needed. For investors, as we would expect, the key ideas may stay on the list longer than the updates for traders. Major market declines occur after business cycle peaks, sparked by severely declining earnings. Our methods are focused on limiting this risk. Start with our Tips for Individual Investors and follow the links.
We also have a page summarizing many of the current investor fears. If you read something scary, this is a good place to do some fact checking.
Other Advice
Here is our collection of great investor advice for this week:
Featured Commentary
If I were to recommend a single source this week, it would be this discussion about Warren Buffett’s answers to questions at the Berkshire annual meeting. There is a persistent misleading theme, citing Buffett’s “favorite indicator” of stock market valuation as evidence of a high-risk market. In fact, Mr. Buffett has not mentioned this in many years. Charlie Munger refuted (via Ben Carlson) the claim. Buffett repeatedly notes that stocks are more attractive than bonds. Those on a mission to keep you scared witless (TM OldProf) repeatedly dredge up the old quote. The specific response this weekend should set the record straight. Briefly put, interest rates matter (not a surprise to my regular readers).
Personal Finance
Professional investors and traders have been making Abnormal Returns a daily stop for over ten years. The average investor should make time for a weekly trip on Wednesday. Tadas always has first-rate links for investors in this special edition. I especially liked this article from Jonathan Clements of the WSJ: What Long Life Spans Mean for Your Money and Career. Those approaching 65 need to think about living, perhaps for another twenty years or more.
Stock Ideas
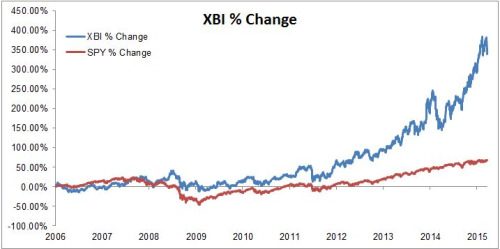
Biotech stocks have sold off sharply. Michael Batnick puts this into perspective by analyzing the pain and the gain. The chart below (comparing the performance of the SPDR S&P Biotech ETF (NYSE:XBI) and SPDR S&P 500 (ARCA:SPY)) makes the biotech success stand out. Meanwhile, nearly half of the time the sector has been in a correction of more than 10%. It takes patience, as well as right-sizing your risk.
Energy
Oil prices artificially low, eventually headed to $60? Interesting analysis from Luay Al-Khatteeb at Brookings.
Practical Advice
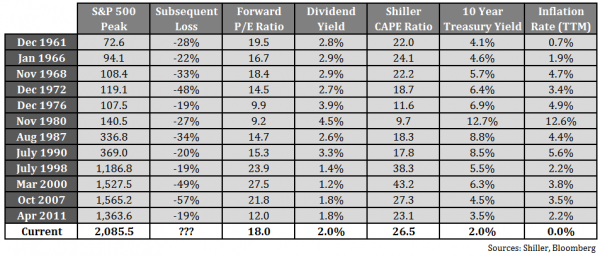
Don’t try to call the top. Take a look at the table from Ben Carlson and see if you can find a pattern.
Cullen Roche explains that it is usually good enough to be right about the general direction of the market — “partly right instead of mostly wrong.”
Watch out!
…for those warning that the “easy money has already been made.” They do not understand that it is never easy, says Morgan Housel.
Barron’s, Nov. 2009: “The Easy Money’s Been Made”
Morningstar, Dec. 2010: “The Easy Money Has been Made”
MarketWatch, Nov. 2011: “The easy money has already been made”
TheStreet, May 2012: “The Easy Money Has Been Made”
Morningstar, Dec. 2013: “The Easy Money Has Been Made”
Barron’s, Oct. 2014: “The Easy Money Has Been Made”
CNBC, March 2015: “The easy Money has been made”
Final Thought
My forecast for the week’s theme often includes topics that I personally do not regard as important.
The Fed will see two monthly employment reports before they next meet in June. Indications are that they would like to start a gentle, prolonged, and varied tightening cycle. It might well last for more than two years before reaching normal levels in short-term rates.
If you accept this as the base case, we should expect strong employment news to encourage a rate increase in June, a little earlier than many market participants expect.
In terms of psychological impact, some will immediately invoke the “Don’t Fight the Fed” language. Those who see the increase in stocks as an artificial result of QE will pounce.
In terms of actual impact, Fed policy will remain accommodative for many months – even years – to come. Stocks have typically done well in the early stages of a tightening cycle.
Traders might choose to game the market psychology, but agility will be needed.
Investors would do better to put aside the obsession with Fed policy, at least until the U.S. 10-Year note yield gets over 4% and/or the yield curve inverts. Until then, good economic news is good news for stocks, despite any knee-jerk reactions.

