Stocks continued their worst start in history. With little sign of dip-buying and the start of earnings season last week, everyone will be wondering:
Can earnings reports provide a floor for stocks?
Prior Theme Recap
In my last WTWA I predicted that everyone would be wondering whether it was time to buy the dip – a strategy that had worked for years. That was a common question and the answer was a resounding, “No!” You can see the sad story for stocks from Doug Short’s weekly S&P 500 chart. (With the ever-increasing effects from foreign markets, you should also add Doug’s World Markets Weekend Update to your reading list).
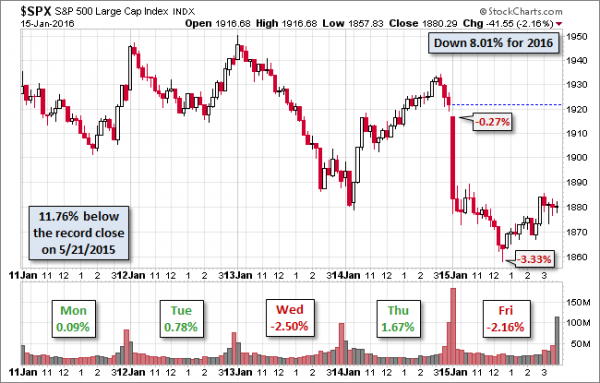
Doug’s update also provides multi-year context. See his full post for more excellent charts and analysis.
We would all like to know the direction of the market in advance. Good luck with that! Second best is planning what to look for and how to react. That is the purpose of considering possible themes for the week ahead. You can make your own predictions in the comments.
This Week’s Theme
There are some economic reports this week, including the most important ones on housing. Despite this I expect a focus on corporate earnings, with a link to the stock market correction. Weak earnings reports will confirm fears, while positive reports may halt the market declines. Everyone will be wondering –
Can earnings season provide a floor for stocks?
Here are the key viewpoints:
- Companies will beat (reduced) expectations, especially outside of energy. Markets will breathe a sigh of relief.
- Earnings will disappoint, particularly anything related to energy or the dollar.
- Earnings do not matter. Current stock selling relates to (pick one or all):
- Excessive valuations
- Broken technical levels
- An inevitable recession
- A Chinese economic collapse and currency devaluation
- Emerging market stress
You can readily find proponents for each of these viewpoints.
As always, I have my own opinion in the conclusion. But first, let us do our regular update of the last week’s news and data. Readers, especially those new to this series, will benefit from reading the background information.
Last Week’s Data
Each week I break down events into good and bad. Often there is “ugly” and on rare occasion something really good. My working definition of “good” has two components:
- The news is market-friendly. Our personal policy preferences are not relevant for this test. And especially – no politics.
- It is better than expectations.
The Good
Despite the extreme selling in stocks, there was a little good news last week.
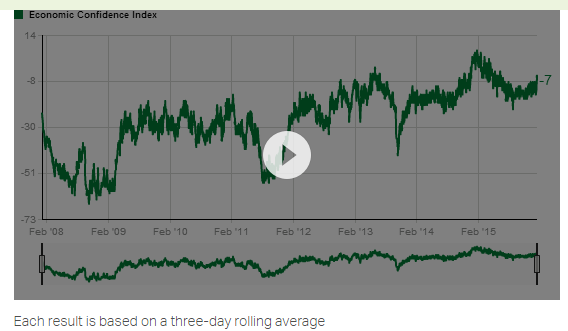
- Consumer sentiment rebounded on the Michigan survey to 93.3, beating both expectations and last month. Most observers in the financial community insist on interpreting these results with reference to stock prices. Most people do not even watch the market that closely. Strong sentiment is positive on the jobs and spending fronts. For a little contrast we can compare to the Gallup daily survey, which uses a three-day rolling average. The reading is well off of last year’s highs, but better than the start of 2016. Check out the Gallup site for the full story and an interactive chart.
- The JOLTS report was solid. Bespoke tracks the jobs available as well as the voluntary quit rate.

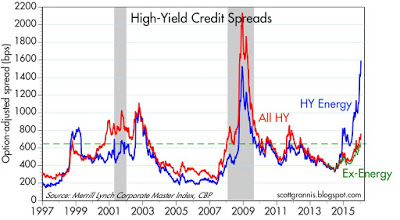
- High-yield debt stress remains contained to energy issues. This is a focal point of current concerns, with some asking if this is a replay of 2008 and subprime lending. Scott Grannis has both analysis and helpful charts.
Sharply lower oil prices have dramatically increased the risk of default for energy-related corporate debt, as shown in the blue line in the first chart above. But the threat of defaults is concentrated in the energy sector. Non-energy high-yield debt credit spreads are only 660 bps, much less than half the 1600 bps spreads on energy-related bonds, and less than the spreads on all HY debt at the peak of the PIIGS crisis. As the second chart above shows, swap spreads are very low, in sharp contrast to how they behaved in previous recessions. Very low swap spreads tell us that financial markets are highly liquid and that systemic risk is very low. This is mostly a problem affecting the oil patch, not everybody.
Markets today are far more liquid than they were in 2008 and 2011-12. That is of critical importance, and a source of comfort.
- The Fed Beige book was solid on employment and housing, but reflected the soft manufacturing data seen in other sources. It is a mixed picture, with a slight positive tilt – unlikely to change the Fed’s course of action. (Marketwatch).
The Bad
Some of the economic data was disappointing.
- Initial jobless claims increased to 284K. The less volatile four-week moving average also moved higher. I watch this closely. It remains at encouraging levels, but the move bears watching.
- Industrial production declined 0.4% on a seasonally adjusted month-over-month basis. Steven Hansen of GEI prefers the unadjusted data and concludes that the story is even worse.
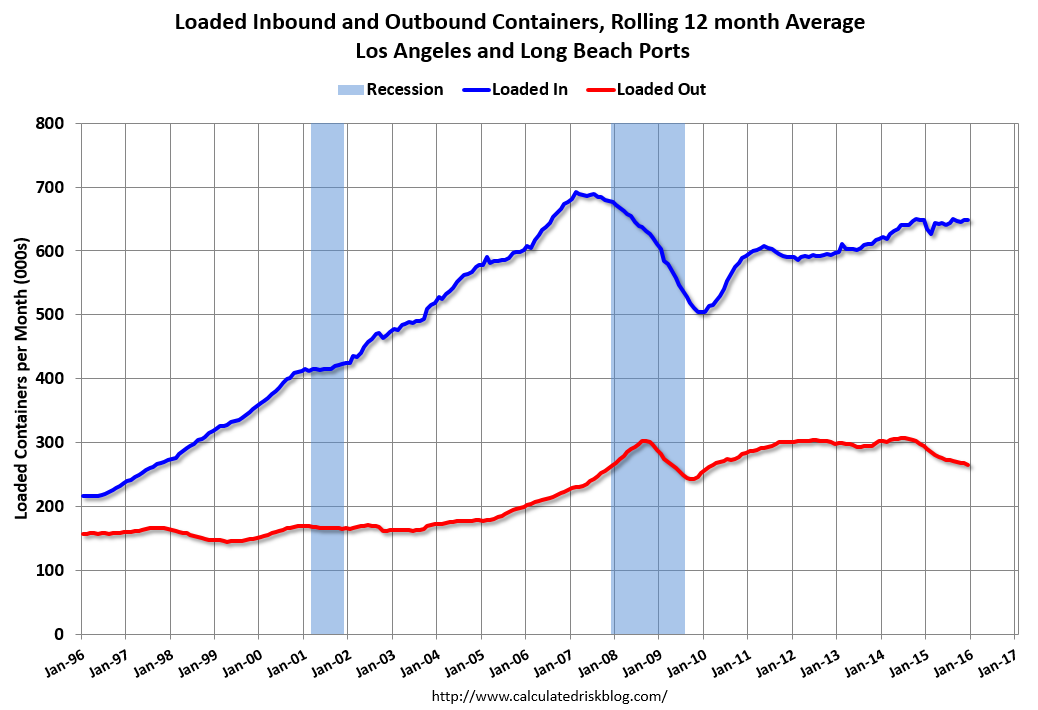
- LA Port traffic declined. Bill McBride attributes the move to China weakness and the stronger dollar.
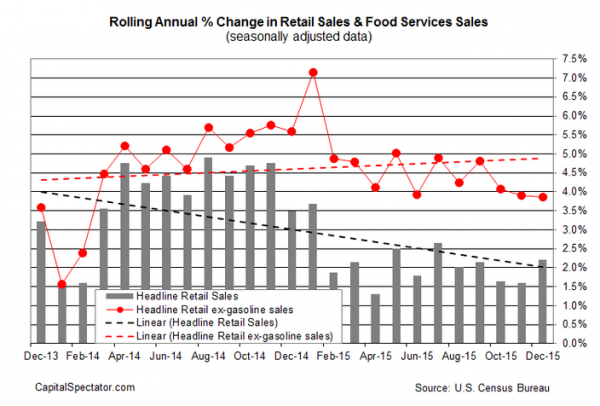
- Retail sales declined slightly, missing expectations. The picture is a little better if we do not consider the dollar decline in gasoline sales (which we often discounted when sales were climbing). James Picerno has good coverage, including this chart:
The Ugly
Infrastructure and water. The sad story of Flint, Michigan may be relevant for other cities as well. (Brookings)
As Flint emerges from its current water crisis, it offers a cautionary tale to several other aging cities nationally. While extreme and unique in some ways, Flint’s predicament reveals broader infrastructure concerns that demand attention.
The Silver Bullet
I occasionally give the Silver Bullet award to someone who takes up an unpopular or thankless cause, doing the real work to demonstrate the facts. Think of The Lone Ranger. No award this week, but you will enjoy our review of last year’s winners. I think you will find the summary fun to read, and the lessons still quite timely.
A Little Fun?
I hope that our annual Hot and Not Hot post will bring a smile to your face. It also might stimulate a few investing ideas, as you recognize how much trends have changed in the last year.
Quant Corner
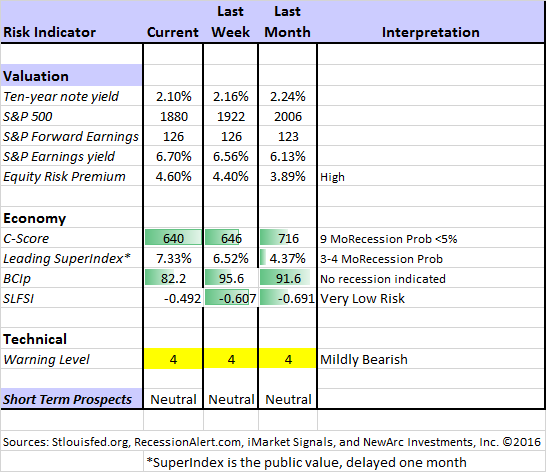
Whether a trader or an investor, you need to understand risk. I monitor many quantitative reports and highlight the best methods in this weekly update. Beginning last week I made some changes in our regular table, separating three different ways of considering risk. For valuation I report the equity risk premium. This is the difference between what we expect stocks to earn in the next twelve months and the return from the ten-year Treasury note. I have found this approach to be an effective method for measuring market perception of stock risk. This is now easier to monitor because of the excellent work of Brian Gilmartin, whose analysis of the Thomson-Reuters data is our principal source for forward earnings.
Our economic risk indicators have not changed.
In our monitoring of market technical risk, I am using our “new” Oscar model. I put “new” in quotes because Oscar is in the same tradition as Felix and the product of extensive testing. We have found that the overall market indication is more helpful for those investing or trading individual stocks. The score ranges from 1 to 5, with 5 representing a high warning level. The 2-4 range is acceptable for stock trading, with various levels of caution.
Oscar improves trading results by taking some profits during good times and getting out of the market when technical risk is high. This is not market timing as we normally think of it, since it is not an effort to pick tops and bottoms and it does not go short. Instead, Oscar identifies and limits risk. (More to come about Oscar).
I considered continuing to report the Felix updates, but I already have a distinction between long and short-term methods. I want to minimize confusion. Those who want this information can subscribe to our weekly Felix updates.
In my continuing effort to provide an effective investor summary of the most important economic data I have added Georg Vrba’s Business Cycle Index, which we have frequently cited in this space. In contrast to the ECRI “black box” approach, Georg provides a full description of the model and the components.
For more information on each source, check here.
Recent Expert Commentary on Recession Odds and Market Trends
Bob Dieli does a monthly update (subscription required) after the employment report and also a monthly overview analysis. He follows many concurrent indicators to supplement our featured “C Score.”
RecessionAlert: A variety of strong quantitative indicators for both economic and market analysis. While we feature the recession analysis, Dwaine also has a number of interesting systems. These include approaches helpful in both economic and market timing. He has been very accurate in helping people to stay on the right side of the market.
Georg Vrba: provides an array of interesting systems. Check out his site for the full story. We especially like his unemployment rate recession indicator, confirming that there is no recession signal. He gets a similar result with the twenty-week forward look from the Business Cycle Indicator, updated weekly and now part of our featured indicators.
Check out Georg’s new mutual fund analysis tool. You can easily see how your fund has done on this fee-adjusted ratings scale.
Doug Short: Provides an array of important economic updates including the best charts around. One of these is monitoring the ECRI’s business cycle analysis, as his associate Jill Mislinski does in this week’s update. His Big Four update is the single best visual update of the indicators used in official recession dating. You can see each element and the aggregate, along with a table of the data. The full article is loaded with charts and analysis.
The pseudo-experts are at it again, with plenty of ill-informed recession forecasts. I explain how to find real experts in this post.
You can check out two experts – Tim Duy and Menzie Chinn – for some outside confirmation of what we have been updating each week.
The Week Ahead
This is a modest, holiday-shortened week for economic data, with some important reports on housing. While I highlight the most important items, you can get an excellent comprehensive listing at Investing.com. You can filter for country, type of report, and other factors.
The “A List” includes the following:
- Housing starts and building permits. (W). Best reads for current housing prospects.
- Initial Claims (Th). The best concurrent news on employment trends, with emphasis on job losses.
- Leading indicators (F). Remains a popular measure of both economic strength and recession potential.
The “B List” includes the following:
- CPI (W). Eventually this will matter, but not yet.
- Existing home sales (F). Not as important as new construction, but still a good overall read on the housing market.
- Crude oil inventories (W). Attracting a lot more attention these days.
There is a little FedSpeak, but the big focus will be on corporate earnings. In addition, before U.S. markets open on Tuesday there are some reports on Chinese economic data and news from Monday’s trading outside of the U.S.
How to Use the Weekly Data Updates
In the WTWA series I try to share what I am thinking as I prepare for the coming week. I write each post as if I were speaking directly to one of my clients. Each client is different, so I have five different programs ranging from very conservative bond ladders to very aggressive trading programs. It is not a “one size fits all” approach.
To get the maximum benefit from my updates you need to have a self-assessment of your objectives. Are you most interested in preserving wealth? Or like most of us, do you still need to create wealth? How much risk is right for your temperament and circumstances?
My weekly insights often suggest a different course of action depending upon your objectives and time frames. They also accurately describe what I am doing in the programs I manage.
Insight for Traders
Oscar continues both the neutral market forecast, and the bearish lean. We are still about 25% invested in this program. There are often plenty of good investments, even in an expected flat market, but the cash certainly provided a nice cushion for both Oscar and Felix last week. For more information, I have posted a further description — Meet Felix and Oscar. You can sign up for Felix and Oscar’s weekly ratings updates via email to etf at newarc dot com. They appear almost every day at Scutify (follow here).
Has 2016 got you feeling burned out already? Dr. Brett Steenbarger explains how to keep control over your emotions and keep losses in check. Hint: Adjust your size in line with volatility.
Insight for Investors
I review the themes here each week and refresh when needed. For investors, as we would expect, the key ideas may stay on the list longer than the updates for traders. Major market declines occur after business cycle peaks, sparked by severely declining earnings. Our methods are focused on limiting this risk. Start with our Tips for Individual Investors and follow the links.
We also have a page (just updated!) summarizing many of the current investor fears. If you read something scary, this is a good place to do some fact checking. Pick a topic and give it a try.
Other Advice
Here is our collection of great investor advice for this week.
If I had to pick a single most important source, it would be Morgan Housel’s Things I’m Pretty Sure About. He looks past his innate skepticism to highlight key elements of his experience. One example:
Investing is an epic battle between your goals, your temperament, and the self-interest of middlemen. Problems are easier solved when you break them down into those three groups.
Stock and Fund Ideas
- Train stocks are feeling the effect of the commodity crush. (Quartz)
- Peer-to-peer lending is under pressure. (Bloomberg)
- Berkshire (N:BRKa, N:BRKb) likes Phillips 66 (N:PSX). Other refiners might have similar attractions. (ValueWalk)
- Chuck Carnevale has (yet another) excellent post combining great lessons on the best stock selection method with some specific ideas.
Energy
- Oil prices might head much lower. (Expert cited on MarketWatch).
- Oil prices might head much higher. (Expert cited on MarketWatch).
Personal Finance
Professional investors and traders have been making Abnormal Returns a daily stop for over ten years. The average investor should make time (even if not able to read every day as I do) for a weekly trip on Wednesday. Tadas always has first-rate links for investors in this special edition. There are several great links, but I especially liked this Tim Maurer (Forbes) article, 10 Things You Absolutely Need to Know about Life Insurance. For example —
#5. Life insurance is a risk management tool, not an investment.
Market Psychology
Markets are in the midst of a 10% correction 55% of the time. (Michael Batnick)
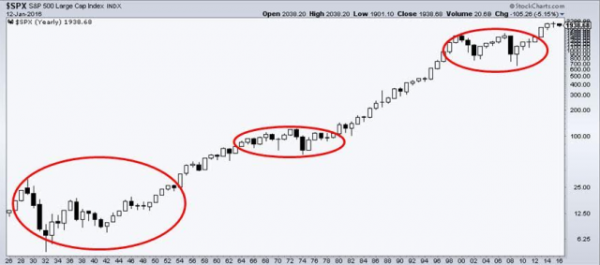
“Davidson” via Todd Sullivan highlights the difference between fundamentals and the popular interpretation of oil prices, calling the result the “Madness of Crowds.” This is an excellent and important post.
Watch out for…
Misleading headlines. In this article we have three things to think about:
-
The headline says, in big bold letters: Oil Heading to $20: Morgan Stanley (N:MS)
- The article says that this might happen if the dollar appreciates another 5%.
- The last paragraph (finally) notes that this is not about deteriorating fundamentals, which is actually the major worry for investors.
Sheesh!
Final Thoughts
As I have been noting, Traders may still need some fancy footwork in the next few weeks. Oscar has been accurate – so far — in reducing trading exposure. Getting back in is another matter.
Turning to investors, they face two questions:
- Is this the start of something big, as so many are warning? The reason for our quant corner is to evaluate the risk of stock declines beyond the “normal” correction of 15-20%. We look at fundamental valuation, recession odds, financial risk, and technical concerns. When something is threatening but does not fit these categories, I provide a human element (as I did at the time of the threatened “fiscal cliff”).
None of our risk indicators signal danger.
- Can investors expect some help from this earnings season?
Probably not. This quarter represents a difficult test. The reaction to the few reports last week was pretty negative. Alcoa (N:AA) did well against lower expectations, but the market seemed to ignore the positives. Intel (O:INTC) beat on earnings and revenue, but disappointed on the outlook. We might need to wait until the next earnings season (April) to see if forward earnings expectations look solid.
The market will be watching earnings for signs that a stronger dollar is a problem, and that is an easy excuse for any company with soft results. No one really knows whether the dollar will get stronger this year, but that remains the expectation.
Amazingly, many pundits expect a stronger dollar based on Fed rate increases, yet simultaneously claim that the Fed will be forced to back off or even reverse course.

