The economic calendar is huge, including the most important monthly data and plenty of earnings reports. With a Fed meeting on the calendar and Tuesday’s decline attributed to the ten-year note touching 3%, the punditry will be asking:
Will economic data drive interest rates higher?
Last Week Recap
In my last edition of WTWA I predicted a renewed effort to find fresh fears. That was right on target. Many of the usual suspects did exactly as expected, moving out the timeline to dismiss current news to find more worrisome subjects.
I felt that the issues last week were especially important, and I appreciate the many readers who found the post to be helpful. Meanwhile, my meetings and travels involved conversations with many intelligent investors. Many of them are frightened by the increase in volatility, instead of embracing the opportunities presented. This fear is not grounded in any data, but the perception is quite real and affecting behavior.
The Story in One Chart
I always start my personal review of the week by looking at a great chart. I especially like the version updated each week by Jill Mislinski. She includes a lot of valuable information in a single visual. The full post has even more charts and analysis, so check it out.
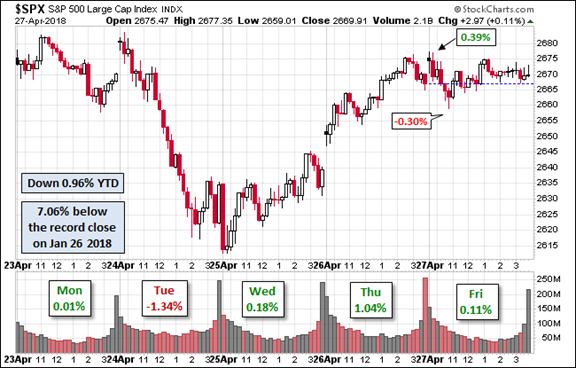
While the market was unchanged for the week, there was plenty of action along the way! Despite the attention-grabbing move on Tuesday, the trading range was only about 2.8%. I summarize actual and implied volatility each week in our Indicator Snapshot section below.
The News
Each week I break down events into good and bad. For our purposes, “good” has two components. The news must be market friendly and better than expectations. I avoid using my personal preferences in evaluating news – and you should, too!
Feel free to add items that I have missed. Please keep in mind that we are looking for current news, especially from the last week or so. WTWA is not about long-term concerns like debt. These are important, of course, but not our weekly subject unless there has been some major change.
The Good
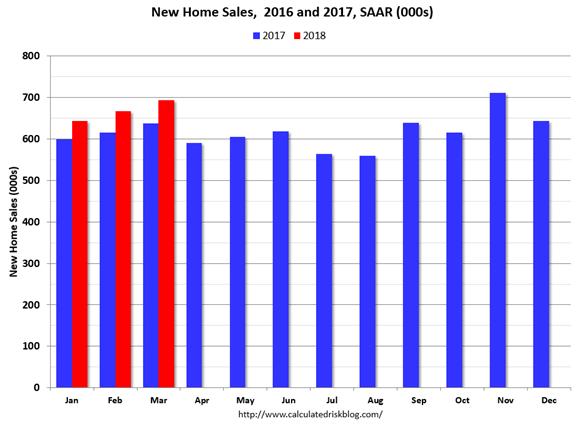
- Housing data showed strength. Existing home sales of 5.6 million (SAAR) were in line with expectations, but new home sales recorded an annual rate of 694K in March. Home prices were also slightly stronger than expected, a 6.8% rate according to the Case-Shiller index. Calculated Risk here and here.
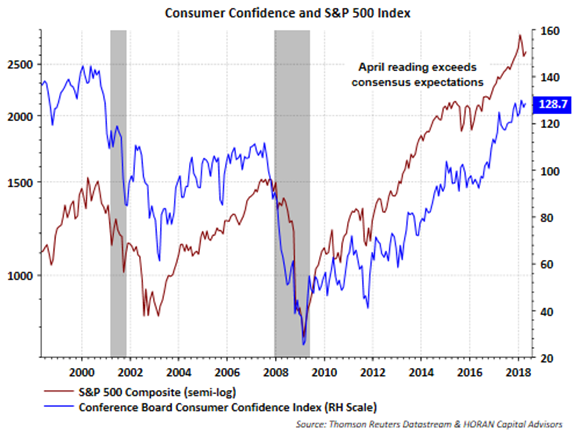
Consumer confidence registered another new high at 128.7, beating expectations of 126.1. This now covers a period after the stock market decline. David Templeton (HORAN) concludes that the consumer is in decent shape, providing a foundation for continuing economic growth.
- Michigan sentiment index also increased to 98.8 beating the March reading of 98.
- Rail traffic improves again. Steven Hansen (GEI) explains the need to remove coal and grain from the analysis. Smoothing with a four-week moving average leads to a gain of 2.8%. He concludes,
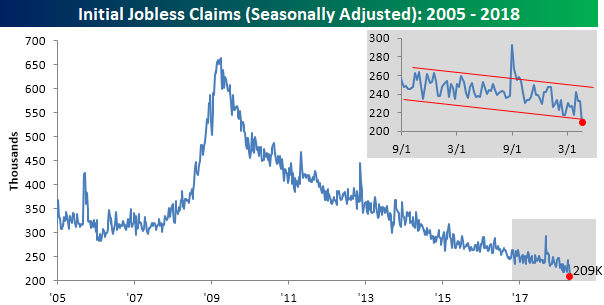
“Intermodal transport growth remains strong year-over-year.” - Initial jobless claims dropped to 209K, much lower than recent levels and the expectation of 230K. (Bespoke)
- Brexit less likely. Remember the market declines when Brexit was first announced? More reasonable possibilities are growing in likelihood. (The Big Picture).
- Durable goods orders showed continuing strength, rising 2.6% (after last month’s upwardly revised 3.5%) and beating expectations of a 1.9% gain.
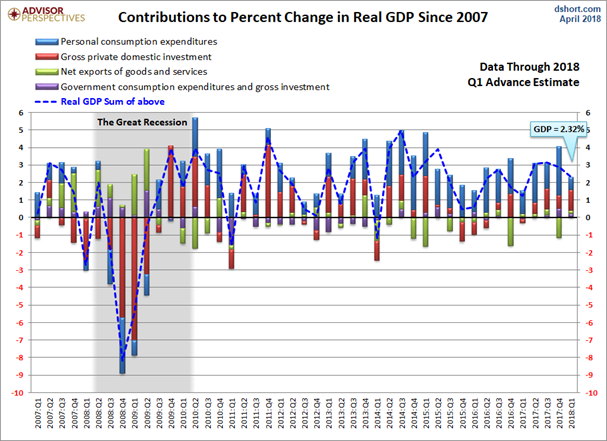
- Q1 GDP increased 2.3%, beating expectations of about 2.1%. While this is just the first estimate, and a decline from 2.9% in Q4, many cited the Q1 softness in recent years. We shall see. Most reports emphasize the headline number, and perhaps a few past comparisons. Ed Yardeni improves on this both with his commentary and his charts. Jill Mislinski’s update shows the contribution of various components, extending over a full business cycle.
 .
.
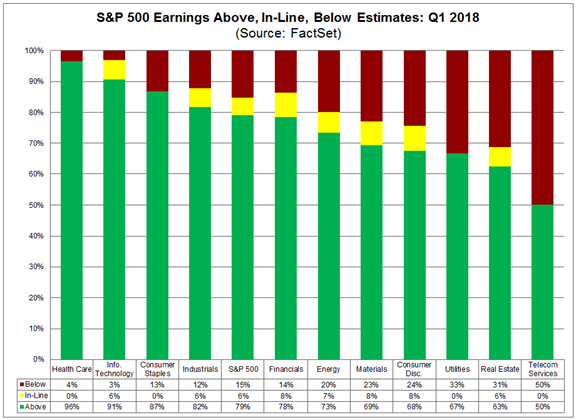
Corporate earnings reports have been great. High expectations have moved even higher, and the beat rates are the best in ten years. (FactSet). This leaves experts searching for explanations, because the response has been “lackluster.” (Brian Gilmartin). Check out his careful, data-based analysis. I especially find the S&P 500 PEG ratio of 0.81 to be very interesting. This seems to be a better gauge of market potential than all the typical perma-bear indicators.
The Bad
- Durable goods ex-transportation showed no gain, in contrast to an expected 0.6% and a 0.9% gain in February.
- The employment cost index increased 0.8%, higher than the 0.7% expected as well as the 0.6% reading in Q4.
- Incautious commentary can have an outsized effect. Caterpillar (NYSE:CAT) announced great earnings and raised its own 2018 forecast by 24%, as Bloomberg reported in Caterpillar Just Gave a Huge Vote of Confidence to the Global Economy.
The CEO said “he isn’t concerned about a peak in the growth cycle.” In between the CFO stated on the conference call that the first-quarter adjusted profit per share “will be the high watermark for the year.” This led to a 10% swing in share prices, as well as an overall market decline. - A Narrow Rebound. The end-of-week rally helped most stocks, but especially the FANG names. More breadth would be encouraging.
Chart of the Century?
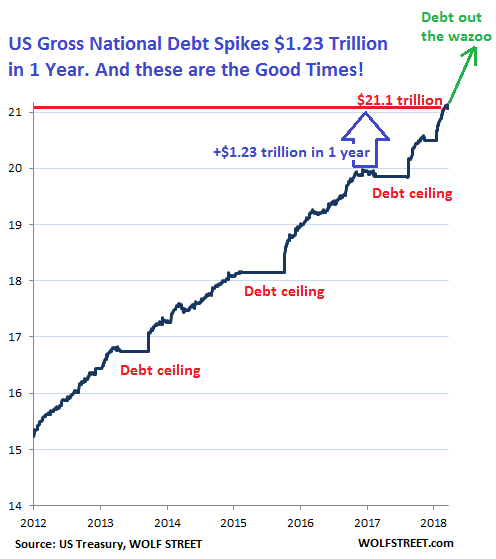
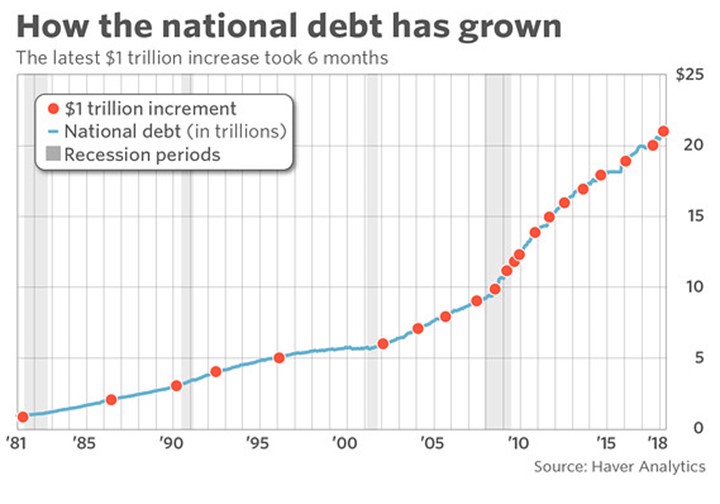
MarketWatch invited a few “financial and economic types” for the chart of the century. What would you expect from this? The article grabbed a lot of attention from several different sources. It included none of the regular chart sources I feature, which is probably not a surprise. Here is the first chart in the article. Do you see anything wrong? How would you improve it? [Some of my own suggestions are at the end of today’s post].
And here is the MarketWatch version.
The Week Ahead
We would all like to know the direction of the market in advance. Good luck with that! Second best is planning what to look for and how to react.
The Calendar
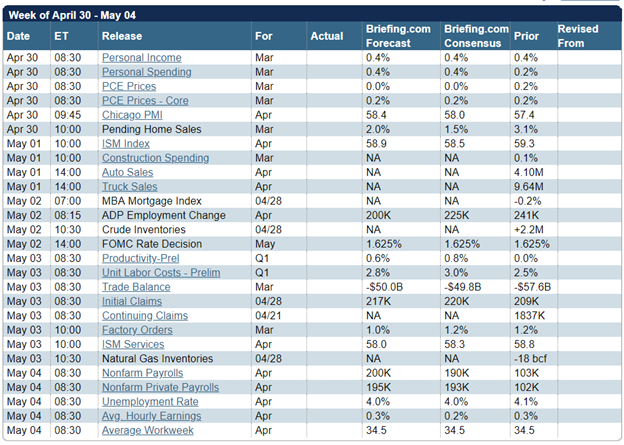
We have a huge economic calendar, including all the most important reports as well as a Fed rate decision. Earnings season is in full swing.
Briefing.com has a good U.S. economic calendar for the week (and many other good features which I monitor each day). Here are the main U.S. releases.
Next Week’s Theme
While few expect the FOMC to increase rates at this meeting, attention will focus on the statement accompanying the decision. Many of this week’s reports will be released after the Fed’s Wednesday meeting, but we can expect them to be interpreted with Fed policy in mind. I expect pundits and financial writers to be asking:
Will strong economic data drive interest rates higher?
The question actually has several parts.
- Will the data show strength?
- What change might the Fed make? Most expect no rate change this week, but there is a growing chance of four rate hikes this year.
- Would such a change affect the long end of the interest rate curve? The slope?
- Schwab doesn’t think so. They also include several of my frequently-made points about volatility and include several points about continuing economic strength.
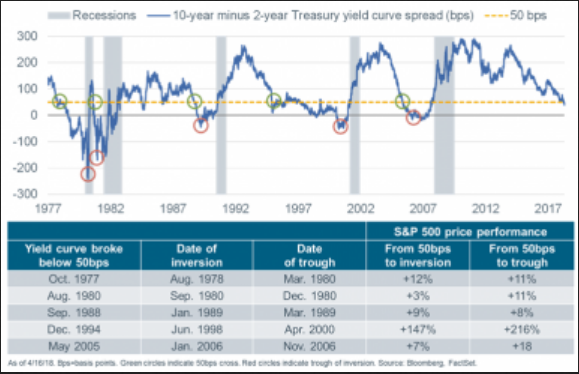
- James Picerno takes a balanced look.
- Could the economic data increase anticipated inflation?
- Would a move past the psychological 3% rate on the ten-year note be significant? Some technicians and traders think so, but those using data have reached a very different conclusion.
- MarketWatch states the various viewpoints.
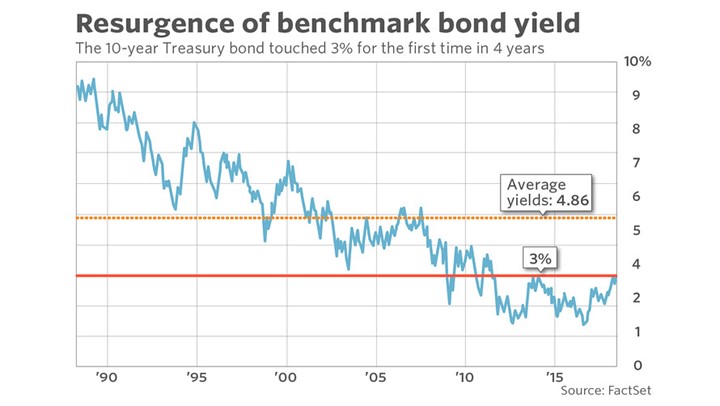
- Scott Grannis sees no overall economic effect and little effect on the number of new home mortgages.
…it is rising demand for loans and a stronger economy which are bidding up the cost of borrowed money. The higher rates of the past year or two are not bad for growth because they are the natural result of stronger growth. Higher rates are only bad when they rise in real terms as a result of tighter monetary policy, but that’s not the case today.
- Morningstar cites 3% as an historically “attractive level for more cautious investors.”
- Scott Rothbort does the math on the concept of bond “safety.”
Let’s say that you buy a 10-Year US Treasury Bond yielding 3% right now. Should you hold that bond to maturity you would indeed receive a 3% annual yield to maturity. However, let’s say that in three years hence, interest rates continue to rise, such that the yield on a 7-year US Treasury would rise to 4%. That is certainly plausible. Should that happen your bond with seven years remaining to maturity would now be valued at (I am rounding) 94 cents on the dollar. You would have lost 6% on your bond, less three years of 3% coupons, resulting in a net gain of 3% in three years’ time. If you factor in inflation, which is currently running at 2.5%, you would have a real loss on your bond investment.
A jump in rates to just 4.5% would, in three years’ time, value that bond at 91 cents on the dollar. The greater the rise in rates, the greater the bond loss. As you can see, you can lose money in bonds
As usual, I’ll save my personal conclusions and suggestions for today’s Final Thought.
Quant Corner
We follow some regular featured sources and the best other quant news from the week.
Risk Analysis
I have a rule for my investment clients. Think first about your risk. Only then should you consider possible rewards. I monitor many quantitative reports and highlight the best methods in this weekly update.
The Indicator Snapshot
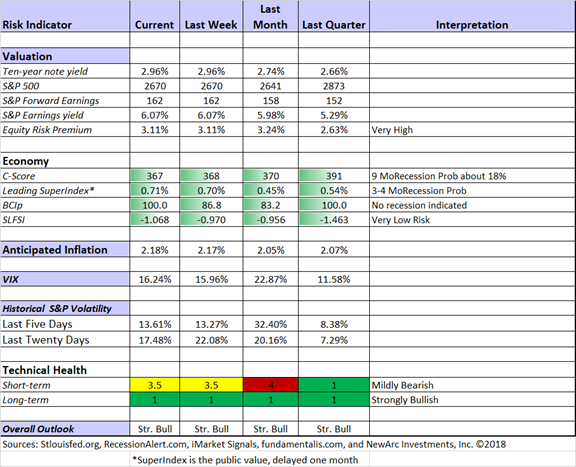
Short-term trading conditions remain in the neutral zone. We continue to monitor the technical health measures on a daily basis. The trading indicator did not drop low enough to take us out of the market in trading programs, but it was close. The long-term fundamentals and outlook are little changed. The long-term technical health is back to strongly bullish.
The Featured Sources:
Bob Dieli: Business cycle analysis via the “C Score.
RecessionAlert: Strong quantitative indicators for both economic and market analysis.
Brian Gilmartin: All things earnings, for the overall market as well as many individual companies.
Georg Vrba: Business cycle indicator and market timing tools. None of Georg’s indicators signal recession.
Doug Short and Jill Mislinski: Regular updating of an array of indicators. Great charts and analysis.
Guests:
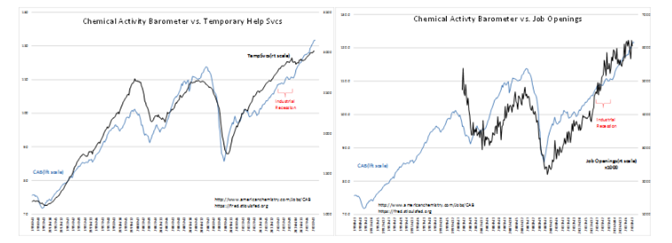
“Davidson” (via Todd Sullivan) provides several charts suggesting 12+ months of further expansion. He also notes that the yield curve remains far from the level where we might start worrying. Here are some examples of his indicators.
Insight for Traders
Check out our weekly Stock Exchange post. We combine links to important posts about trading, themes of current interest, and ideas from our trading models. This week we had some fun, featuring a bogus and ominous chart formation. As usual, we discussed some stock ideas and updated the ratings lists for Felix and Oscar, this week featuring the DJIA stocks. Blue Harbinger has taken the lead role on this post, using information both from me and from the models. He is doing a great job, presenting a wealth of new ideas and information each week.
While I emphasize trading in the Stock Exchange series, it often has implications for long-term investors. I recommend a visit to check it out.
Insight for Investors
Investors should have a long-term horizon. They can often exploit trading volatility! I remind investors of this each week, but now is the time to pay attention.
Best of the Week
If I had to pick a single most important source for investors to read this week it would be John Rekenthaler’s (Morningstar) attack on the overuse of “bubble” with special attention to a recent report from Research Affiliates. He notes that the report treats the idea of over-valuation as self-evident, and a preface for analysis of global technology stocks.
Perhaps, but it certainly reflects the common perception in financial media. Rekenthaler writes:
I don’t see a bubble–certainly not with the overall U.S. stock market. With a forward earnings yield of 6% (earnings yield being the inverse of a P/E ratio: earnings divided by price), at a time when 10-year Treasuries pay 3% and annual inflation hovers around 1%-3%, stocks are not dear when compared with the alternatives. At some point, of course, the economy will turn; those P/E ratios will spike because earnings collapse; and stocks will get shellacked. But the same could have been written in 2012, and 2013, and so forth. Without further evidence, why believe this year is different?
And later…
Many bubbles are proclaimed, but few arrive. The word is not useful; rather than signal something extraordinary, it has come to mean “securities I don’t like because they strike me as being too expensive.”
Stock Ideas
Chuck Carnevale concludes his five-part series on fifty dividend growth stocks. With his customary attention to measuring value and discussing methods, readers get a great lesson as well as some stock ideas.
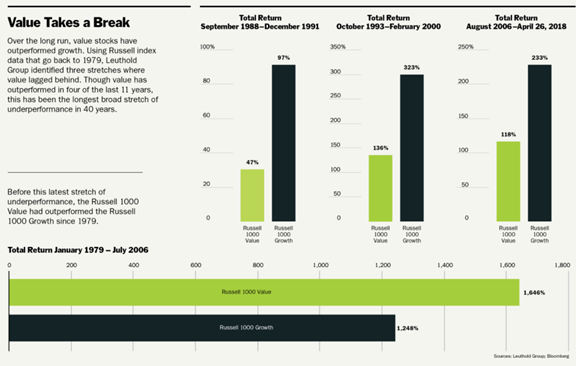
Time for value stocks? Barron’s, in the cover story, analyzes the recent lag versus growth stocks, and what might change.
