We have a light calendar for economic data. The week’s focus will be the FOMC policy announcement on Wednesday. Given the resilience of the market rally in the face of various natural and human threats, the punditry will turn to a favored topic. Expect people to be asking:
Will the Fed be the catalyst for a market correction?
Last Week Recap
My expectation for last week was only partly correct. There was plenty of competing news and not much optimism about a market-friendly legislative agenda.
The Story in One Chart
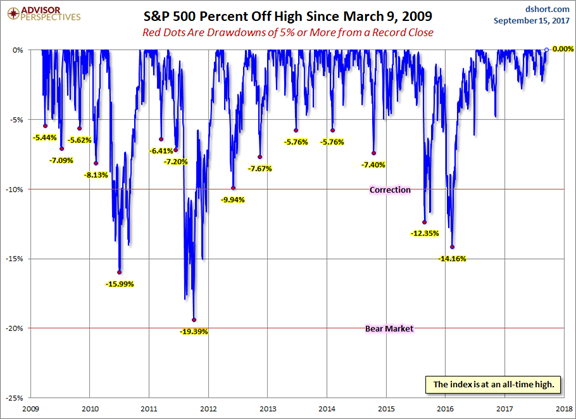
I always start my personal review of the week by looking at this great chart of the S&P 500 from Doug Short via Jill Mislinski. Monday’s big rally was sparked by the weakening of Irma and lowered damage estimates. After some follow through on Tuesday, the market was flat for the rest of the week.
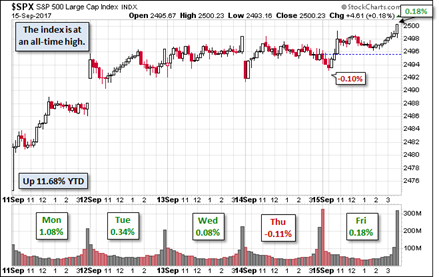
Doug has a special knack for pulling together all the relevant information. His charts save more than a thousand words! Read the entire post for several more charts providing long-term perspective, including the size and frequency of drawdowns.
Personal Note
I am off next Saturday, so there might not be a WTWA post. If I can, I will do an abbreviated version, but it might be a day late.
The Silver Bullet
As I indicated recently I am moving the Silver Bullet award to a standalone feature, rather than an item in WTWA. I hope that readers and past winners, listed here, will help me in giving special recognition to those who help to keep data honest. As always, nominations are welcome!
The News
Each week I break down events into good and bad. For our purposes, “good” has two components. The news must be market friendly and better than expectations. I avoid using my personal preferences in evaluating news – and you should, too!
There was little economic news, but it was generally positive. The negatives were not very significant.
The Good
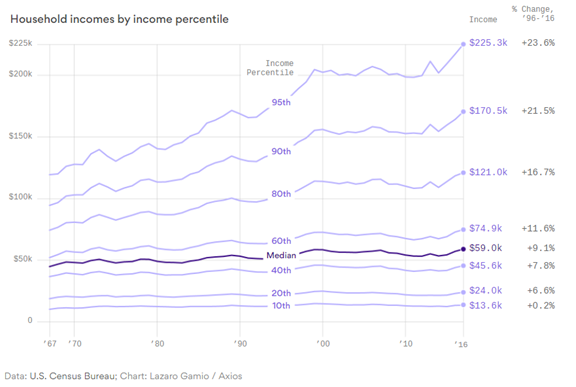
- U.S. median income increases for the second year in a row. Christopher Matthews (Axios) has details.
- Corporate executives remain optimistic about the economy. Avondale conference call summaries provide great context for the data we follow.
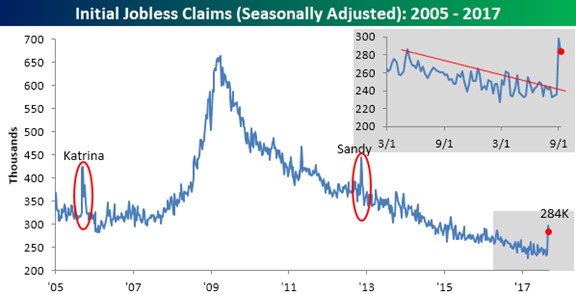
- Initial jobless claims moved lower, despite the Harvey and Irma effects. Bespoke charts the data and New Deal Democrat shows how a hurricane adjustment makes the picture even better, 239,000. Eddy Elfenbein also weighs in.
- House passes government funding. So far, so good. (Reuters) And it is possible that tax reform (cuts) would be backdated to the start of 2017. We can expect a more complete outline in two weeks.
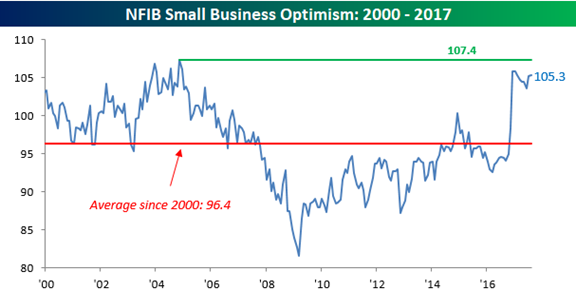
- Small business optimism remains strong and beats expectations. (Bespoke)
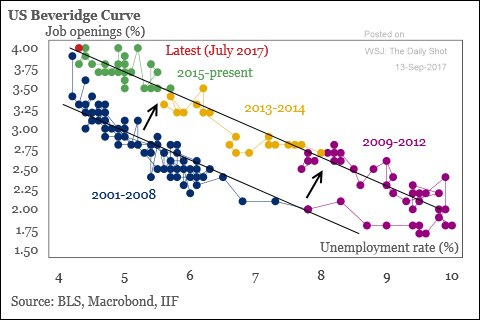
- JOLTs showed a solid and improving picture. The Beveridge curve and the voluntary quit rate are the key elements. Contra – New Deal Democrat questions the data.
The Bad
- Industrial production fell 0.9%, a decline from last month’s gain of 0.4%, and missing expectations of a gain of 0.2 to 0.3%. Steven Hansen (GEI) notes the headline loss. His expected deep dive into year-over-year comparisons and unadjusted data is less discouraging.
- Retail sales declined 0.3% compared to a prior month gain of 0.3%, which was revised down from 0.6%. Expectations were for a modest increase. Reuters attributes the decline to hurricane effects. Perhaps so, but we will have some noisy data for the next couple of months (at least).
The Ugly
Irma aftereffects. Especially the death of senior citizens in facilities that lost power.
Noteworthy
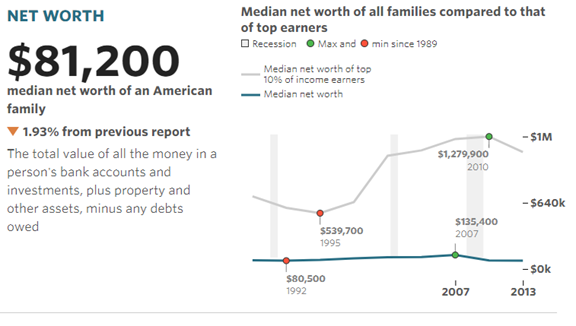
What is your financial health? Check out the data from MarketWatch showing ten indicators, updated in real time. While 70% of Americans say they are living comfortably or doing OK, nearly half could not cope with a $400 emergency. Here is one example.
The Week Ahead
We would all like to know the direction of the market in advance. Good luck with that! Second best is planning what to look for and how to react.
The Calendar
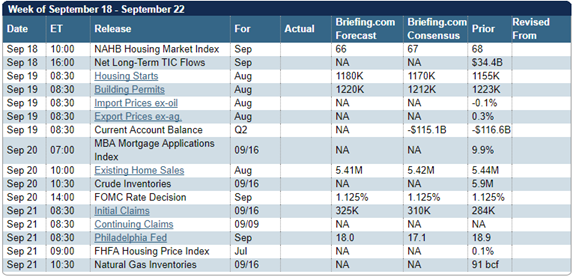
We have a light economic calendar. The housing data are important, but Wednesday’s FOMC decision and Chair Yellen’s press conference will take the spotlight. Other Fed participants will also hit the speaking trail after the meeting.
Briefing.com has a good U.S. economic calendar for the week (and many other good features which I monitor each day). Here are the main U.S. releases.
Next Week’s Theme
There is widespread agreement (perhaps mistaken) about the role of Fed policy in current asset prices. We also have an over-supply of armchair experts on what the Fed should be doing. This comes at a time when significant market drawdowns have been few and modest. Jill Mislinski illustrates this key element of background—only two drawdowns of more than 10% in the last six years. Even North Korean missile launches have little effect in the current market.
Is this a dangerous combination, waiting for a catalyst? Expect many to be asking:
Will a more aggressive Fed spark the long-awaited correction?
The Fed is always a topic for discussion, but it reaches some higher level every six months or so. I always take a fresh look at the week ahead, but it sometimes helps to remember the history of a specific issue. Here is my summary of a discussion of Fed tightening from one year ago.
An abbreviated sequence of the week’s events:
Stock futures were set up for a flat opening, just as we had seen all week.
Boston Fed President Eric Rosengren, repeating a speech made in August, stated that gradually removing accommodation was the best way to extend the duration of the recovery. The Boston Globe states that this pushed the Dow 400 points lower.
Stock futures moved lower by about ½ of one percent when the speech was reported.
Since markets are not expecting a September rate increase, and only a 60% chance of one before the end of the year, the original move attracted a lot of discussion.
When the Dow declined a little more, CNBC started running the headline that Fed fears were slamming stocks.
Several commentators cited the possible end of the Fed support for asset prices. Art Cashin fed the fire, noting in mid-afternoon that if stocks were down 300 on just the hint, an actual increase might take them down 1000.
We might well ask what has changed. Here are the key viewpoints:
- At last! If the Fed quits propping up the market, maybe stocks will get to the “normal” valuation. Contra – Dr. Ed Yardeni.
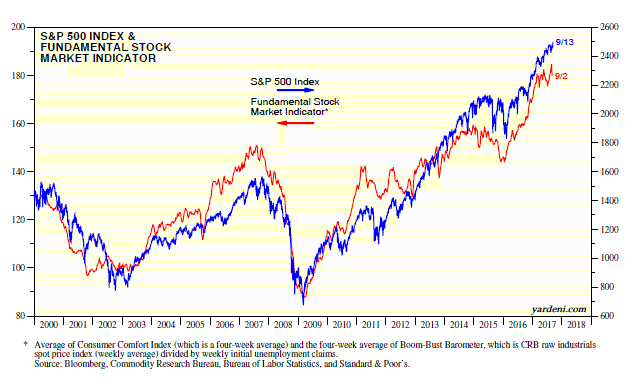
- The Fed has been consistently wrong on policy. It has waited too long to raise rates, missing the best opportunity. There is no dry powder for the next recession, which may happen at any time.
- The Fed has been consistently wrong on policy. The threatened deflation from a weak global economy is not ready for more aggressive Central banks. (Tim Duy).
- Fed policy is changing, but only very gradually. The impact will be modest.
- Market-timers are anticipating a decline, implying a limited effect. (Mark Hulbert).
- No one knows the consequence of this policy shift. (Greg Robb, MarketWatch).
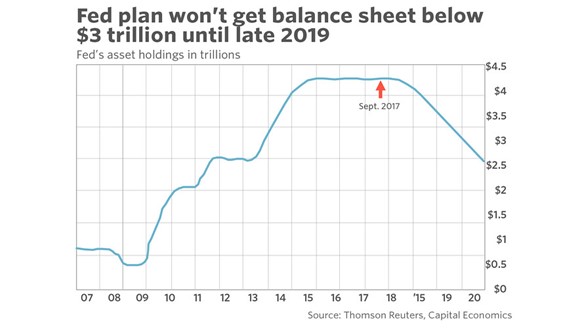
- The importance of Fed policy changes is not very important in the current low-rate environment.
As usual, I’ll have more in the Final Thought, where I emphasize my own conclusions.
Quant Corner
We follow some regular featured sources and the best other quant news from the week.
Risk Analysis
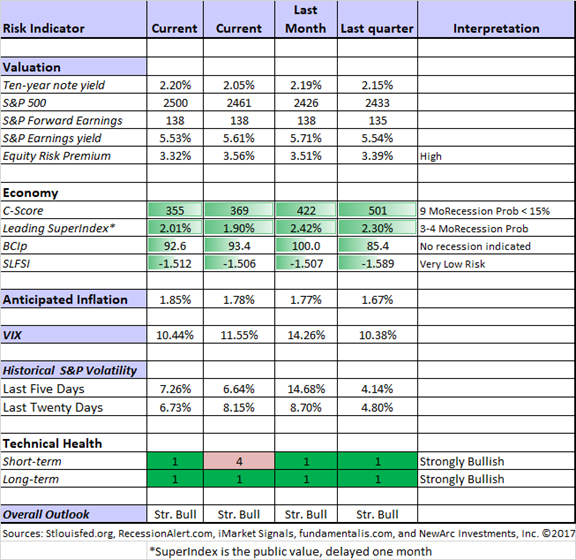
I have a rule for my investment clients. Think first about your risk. Only then should you consider possible rewards. I monitor many quantitative reports and highlight the best methods in this weekly update.
The Indicator Snapshot
Notes on changes:
We have added a distinction between the technical appeal of the market on a short-term (two months or so) and a long-term basis. The mildly bearish interpretation for last week did not imply a full exit from trading. It was a warning that conditions are not as attractive. As you will see, this indicator can move fairly rapidly.
The nine-month recession probabilty from the C-Score remains at <15%. This is a curvilinear relationship. The odds move only gradually in the current range.
The Featured Sources:
Bob Dieli: Business cycle analysis via the “C Score.
RecessionAlert: Strong quantitative indicators for both economic and market analysis.
Brian Gilmartin: All things earnings, for the overall market as well as many individual companies.
Georg Vrba: Business cycle indicator and market timing tools. It is a good time to show the chart with the business cycle indicator.
Doug Short: Regular updating of an array of indicators. Great charts and analysis.
Featured Guest Source
CXO Advisory does top-notch, professional research on the topics important to investors. I often find myself wondering about some piece of conventional wisdom that lacks proper evidence. I find myself wishing that I had a bigger research staff. Then I consult the CXO Advisory archive and discover a thorough analysis. Here is an example.
Nearly every week I see a post citing the increase in margin debt. The assertion is that danger is signaled because people are borrowing money to buy stocks. Those providing a chart as evidence do not analyze effectively whether this is a leading, coincident, or lagging indicator. This is not something you can readily see by inspection. In February, I cited Paul Hickey of Bespoke for the Silver Bullet. His analysis showed the market results after a period of margin debt declines of 10% or more, finding no difference.
CXO has an excellent analysis. This is members-only research, but I am asking them to make this article public as an example. Meanwhile, (with permission) here are some key conclusions:
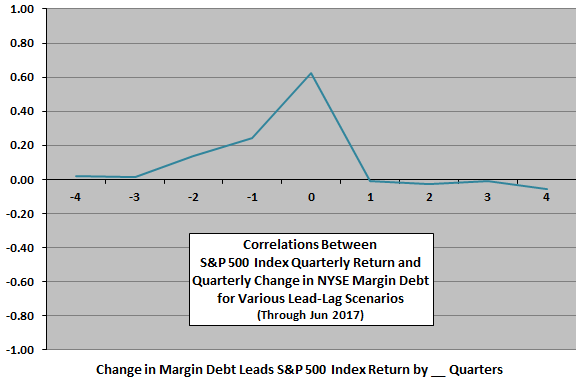
The Pearson (LON:PSON) correlation for the two series is 0.39 and the R-squared statistic is 0.15, indicating that monthly change in margin debt explains 15% of the same-month movement in the S&P 500 Index. This result confirms a tendency of the two series to move together.
However, the correlation between next-month S&P 500 Index return and monthly change in NYSE margin debt is 0.00 and the R-squared statistic therefore also 0.00, indicating that the latter has no ability to predict the former at a one-month horizon.
There are several interesting and convincing charts, showing the effects over several time frames. This one summarizes the key point: Margin debt lags changes in markets.
Reading through the CXO archives lets you check out the record of various “guru’s” and the facts behind many popular market truisms. Any thoughtful consumer of investment information will find this subscription worthwhile.
Insight for Traders
We have not quit our discussion of trading ideas. The weekly Stock Exchange column is bigger and better than ever. We combine links to trading articles, topical themes, and ideas from our trading models. This week’s post covered the need to find trades that fit your personal style. Blue Harbinger has taken the lead role on this post, using information from me and from the models. He is doing a great job.
Insight for Investors
Investors should have a long-term horizon. They can often exploit trading volatility!
Best of the Week
If I had to pick a single most important source for investors to read this week it would be Adam F. Grossman’s interesting discussion of Warren Buffett’s decision NOT to buy Microsoft (NASDAQ:MSFT). I won’t spoil the story, but the lesson about defining and sticking to your competence is a good one. Here are some of the key points:
This will look different for each individual, but here’s the overall approach I recommend. It’s five steps: (1) Articulate your goals; (2) Quantify each goal; (3) Attach a time frame to each goal; (4) Develop and implement an investment plan for each goal; (5) Review your plan at least once a year and modify it as your circumstances change.
Stock Ideas
Our ideas this week have a focus on yield, although the methodology differs.
Chuck Carnevale analyzes his long position in Visa (NYSE:V). Knowing when to exit is important. Valuation helps with this decision.
Brown-Forman (NYSE:BFa) is a fast-growing dividend aristocrat, and part of Warren Buffett’s portfolio. The same source, Simply Safe Dividends, cites Walgreen Boots Alliance (NASDAQ:WBA) as part of the Bill Gates portfolio. Both stocks are worth consideration on the merits, but not because of who owns them. People are competent in different spheres. Both Mr. B and Mr. G are worthy of admiration for their accomplishments and social commitment. It does not mean that Mr. G is a great stock picker or that Mr. B’s portfolio is suitable for you. Mr. B can beat me at investment analysis and baseball trivia. Mr. G has me on business vision, software, and world health. Less importantly, I can beat them at bridge!
And here are ten reasons that Berkshire Hathaway (NYSE:BRKa) is a “screaming buy.”
Brian Gilmartin has a careful analysis of Coke’s (NYSE:KO) strengths and challenges.
Blue Harbinger analyzes the top health care REITs, most of which we own.
Market Folly has a nice summary of ideas from the Delivering Alpha conference.
Personal Finance
Seeking Alpha Senior Editor Gil Weinreich has an interesting topic every day. His own commentary adds insight and ties together key current articles. This week, among several good posts, he has one that shows special value both for advisors and investors. Once again, he reviews and discusses reader comments, a valuable part of the series. One of his links is today’s “best investment advice” (see above). This is a good daily read for both investors and advisors.
Abnormal Returns has a different topic each day. I read them all, but individual investors might find the Wednesday focus most relevant. There are always many great links. My favorite this week is Michael Kitces’ analysis of the challenges in using a funded ratio for retirement planning. Here is a key quote from the summary:
An increasingly popular strategy to give context to the progress of saving towards a (retirement) goal is the funded ratio – where the current account value is presented as a percentage of the total savings necessary to achieve the goal (or at least, be on track for the goal with an assumed growth rate).
The virtue of the funded ratio is that it takes an abstract account balance and relates it directly to a goal or outcome, and can give savers a sense of accomplishment as the percentage slowly and steadily climbs towards 100%. The bad news, though, is that once account balances grow large, the funded ratio itself can become highly volatile as markets move up and down, and the discount rate used to calculate the funded ratio can unwittingly turn into an indirect absolute return benchmark that is difficult to keep up with.
Watch out for….
Eddy Elfenbein notes that the Dow would be down for the year if priced in euros. Currency effects can be important when making foreign investments.
Exxon Mobil (NYSE:XOM). Is the company overly optimistic about oil prices?
Verizon (NYSE:VZ). Competition not letting up.
Final Thoughts
Is it now time to fear the Fed?
- The change in the Fed balance sheet is modest given the size of the overall market. (here and here)
- The policy change has been well-advertised. (Leading Fed expert Tim Duy).
- The balance sheet was never the main driver of market strength.
Is a correction imminent?
- I don’t know. Neither does anyone else.
- While the change in Fed policy has little substantive meaning, expect plenty of spin.
- There is always a chance for a self-fulfilling prophecy.
- Anticipating corrections is not a profitable investment strategy. (Historical analysis based on Shiller data and CAPE. Victor Haghani and James White)
What worries me…
- Wasting the opportunity to shake up existing Washington alliances. Most of the needed policies require bipartisan cooperation between moderates. Last week saw little progress beyond the initial actions.
…and what doesn’t
- Market valuation. Some day there will be a reconsideration of the methods that have frightened so many for so long. A continuing focus on growth in earnings expectations has worked well.
- The Fed.
