Summary
This week featured a number of charts showing overbought signals and overly optimistic sentiment and valuations.
At the same time, there were also charts illustrating the positive trends in the fundamentals as the economic cycle matures.
It has many classic signs of a late stage bull market.
Those who follow my personal account on Twitter will be familiar with my weekly S&P 500 #ChartStorm in which I pick out 10 charts on the S&P 500 to tweet. Typically, I'll pick a couple of themes and hammer them home with the charts, but sometimes it's just a selection of charts that will add to your perspective and help inform your own view - whether it's bearish, bullish, or something else!
The purpose of this note is to add some extra context beyond the 140 characters of Twitter. It's worth noting that the aim of the #ChartStorm isn't necessarily to arrive at a certain view but to highlight charts and themes worth paying attention to.
So here's another S&P 500 #ChartStorm write-up!
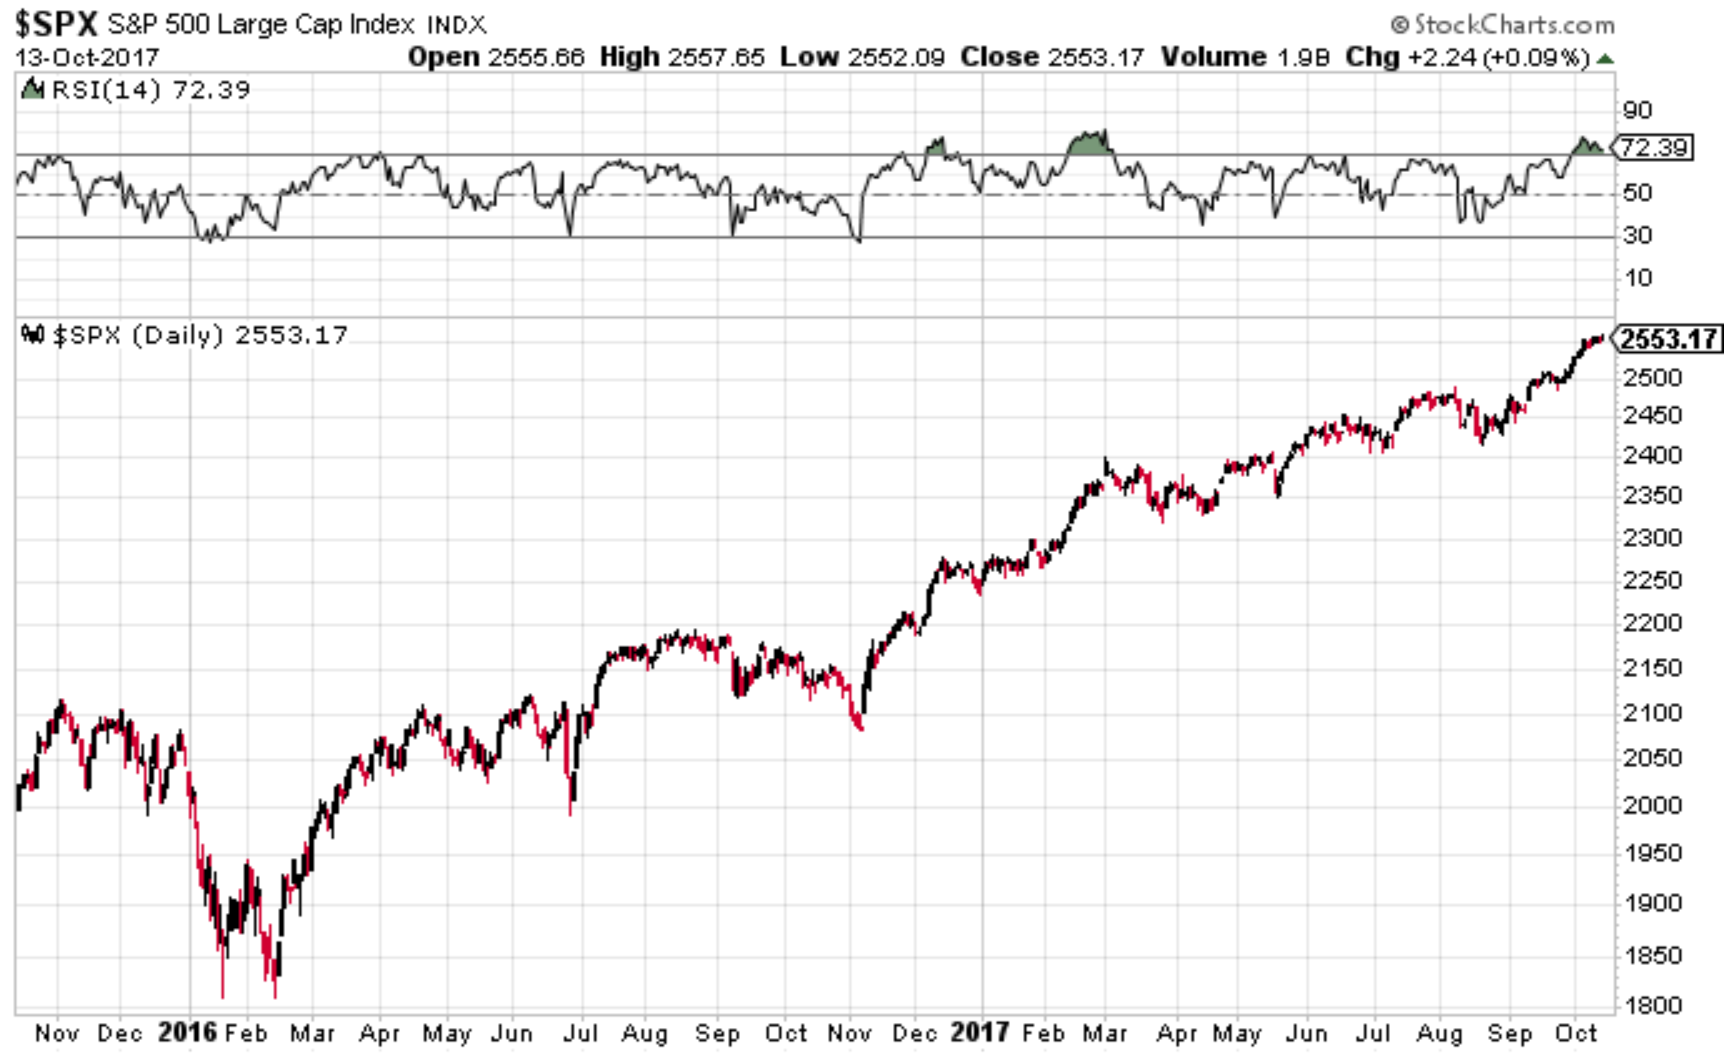
1. Overbought RSI: The classic 14-day RSI for the S&P 500 has put in a textbook overbought signal. The signal comes when the RSI heads above 70 and then turns down. Typically, it will result in a short-term top which may be followed by a selloff of some size or period of consolidation.
Bottom line: The S&P 500 RSI is flashing an overbought signal.
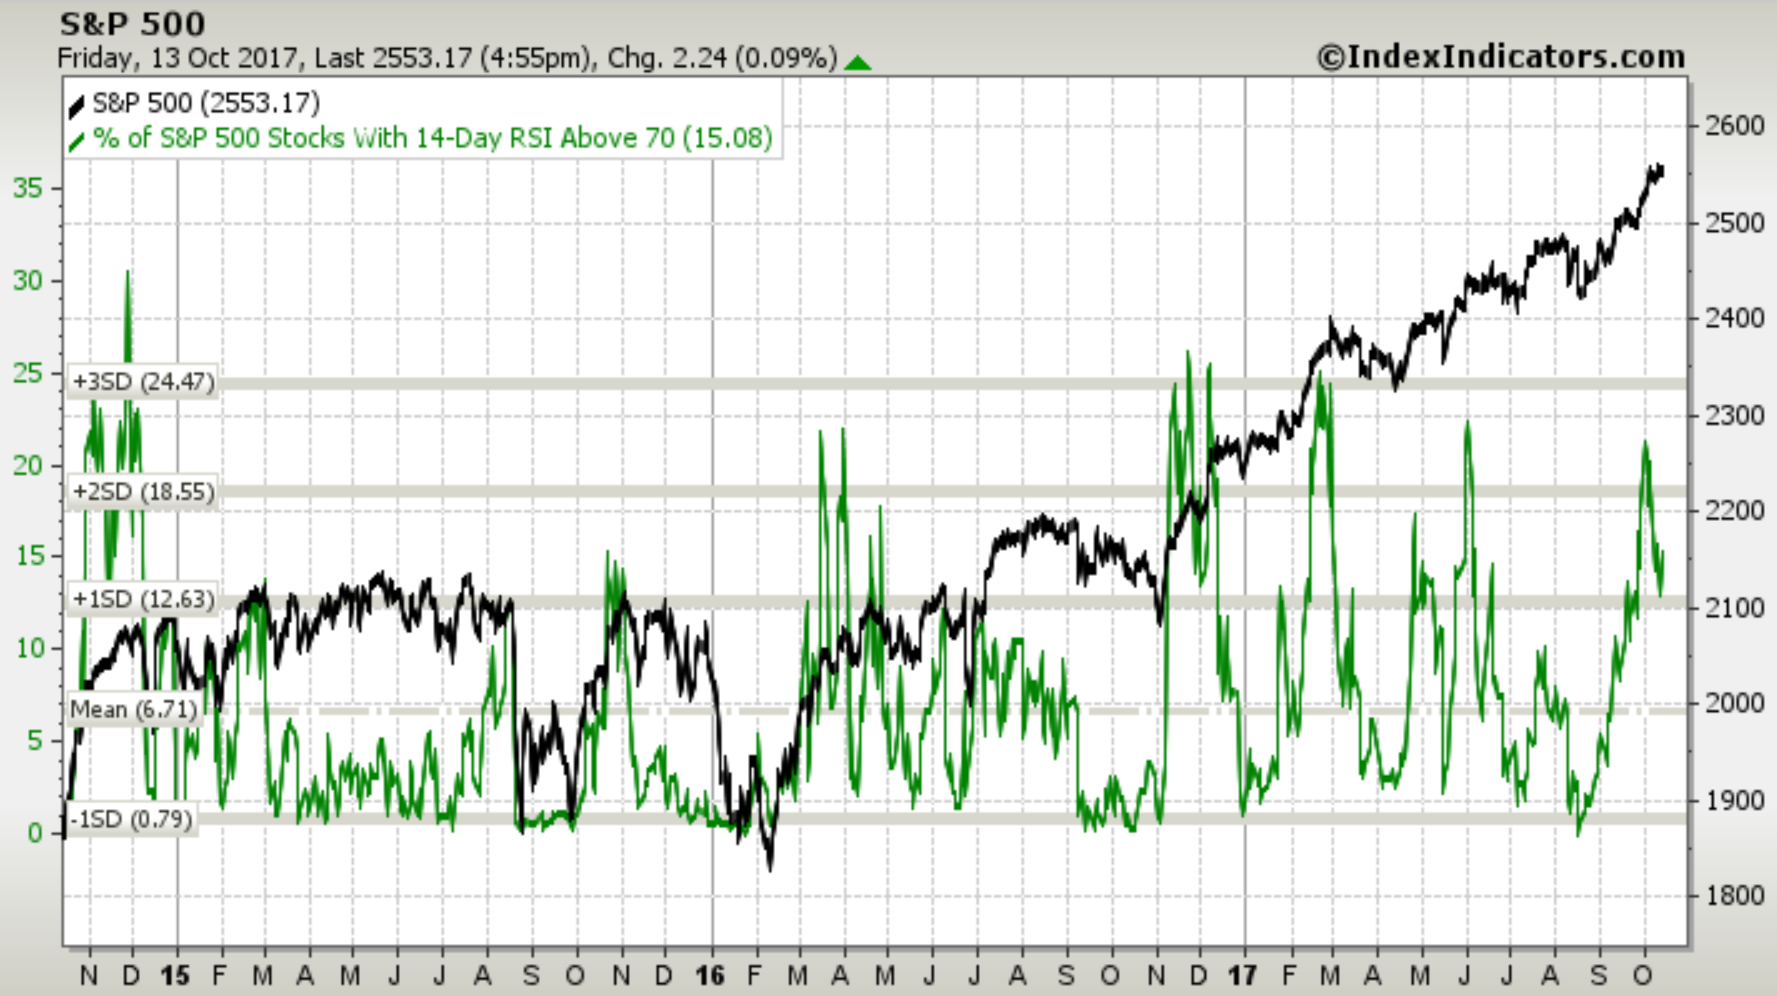
2. Spike in overbought RSI breadth: On a very similar note, this chart shows you the breadth view, i.e., the percentage of S&P 500 stocks with a 14-day RSI above 70. You can see that spikes in this indicator are often followed by at least a short-term pause. So again, this is another overbought signal.
Bottom line: RSI overbought breadth is at elevated levels.
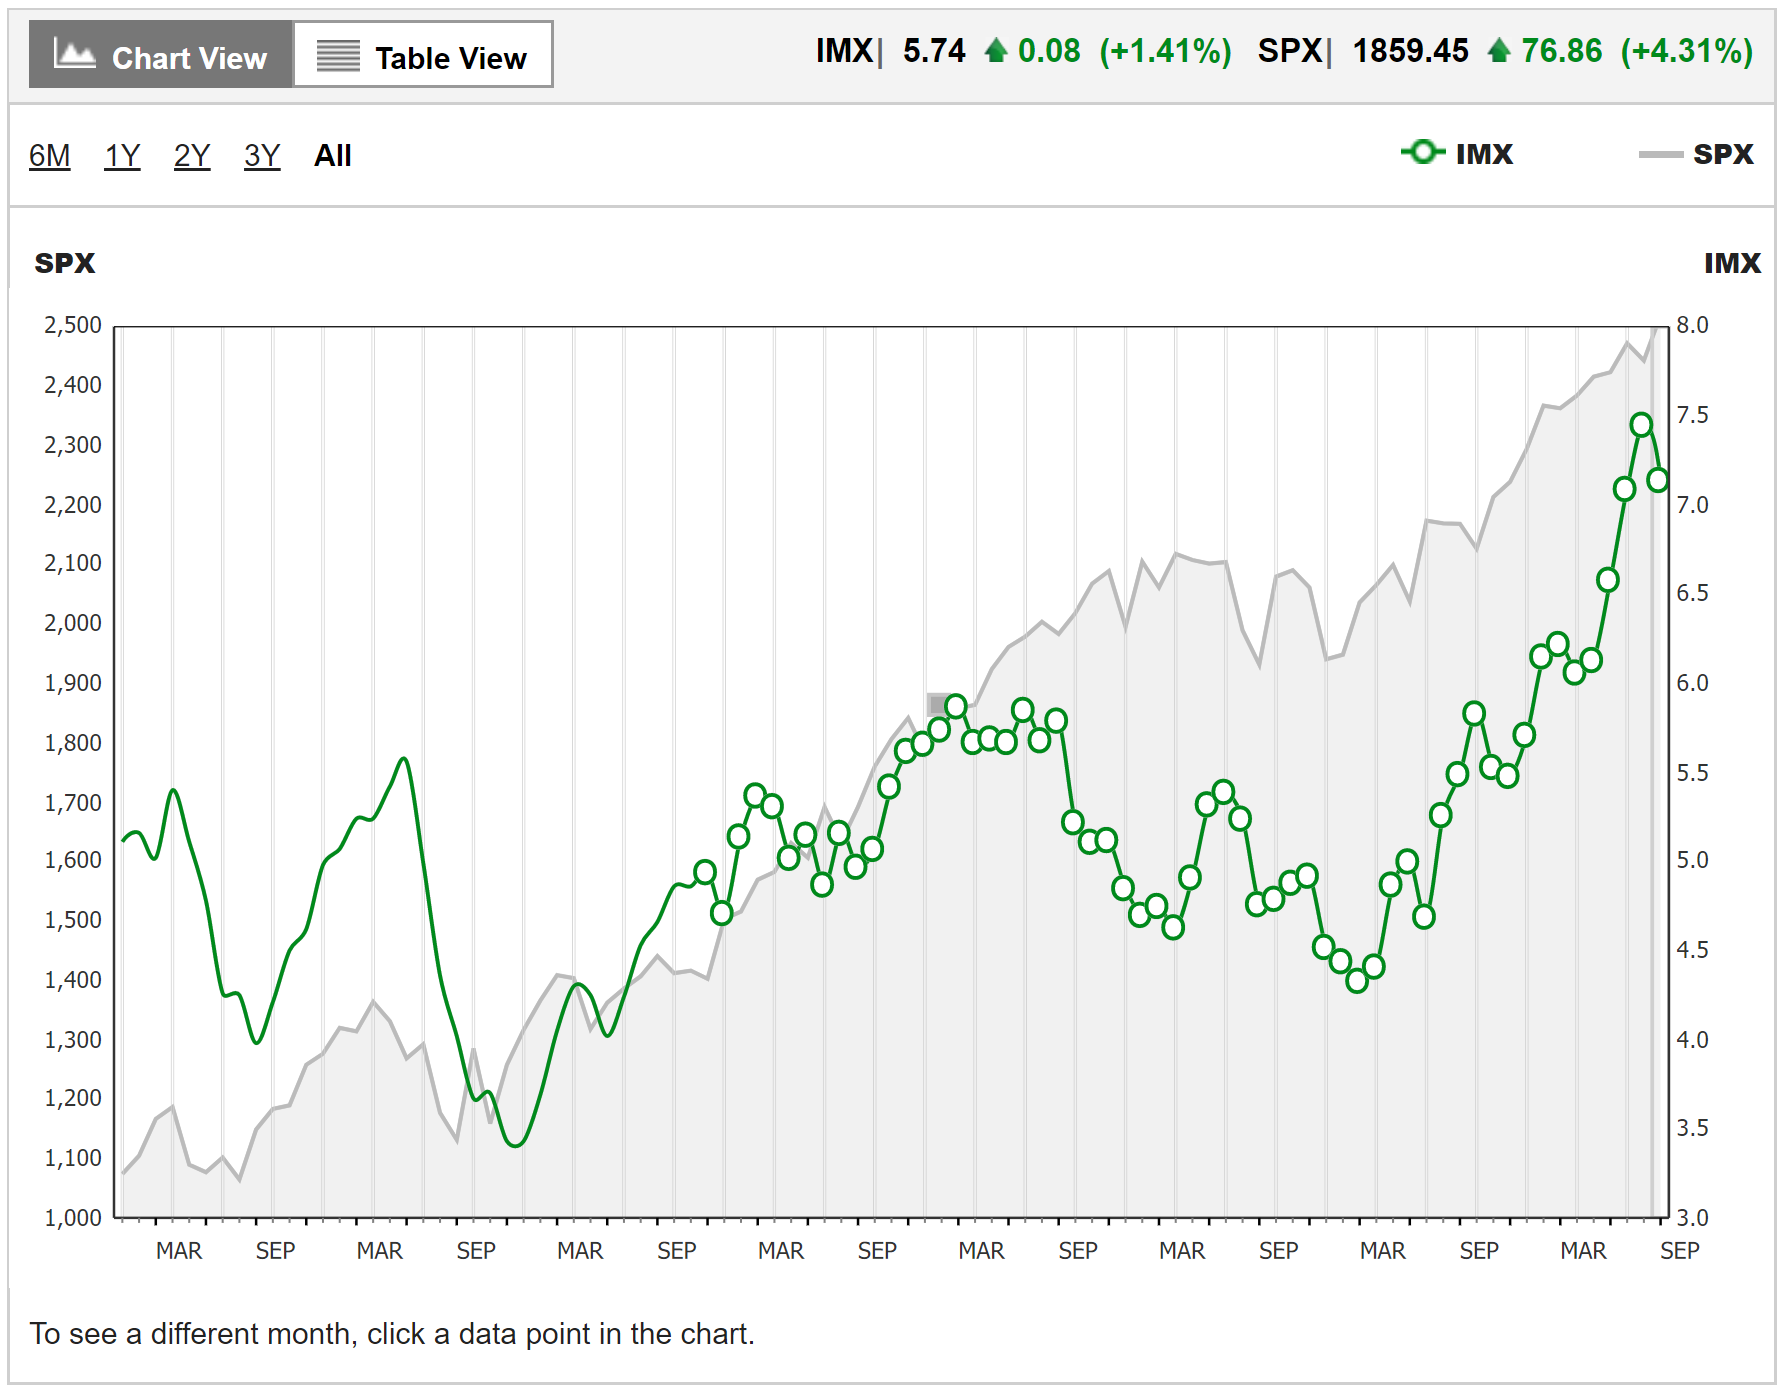
3. The Investor Movement Index: The TD IMX uses the actual buying and selling data derived from TD Ameritrade's brokerage business to provide an insight into the buying/selling trends of retail investors. It gives a really interesting view into investor sentiment based on actions rather than words, and it shows that investors have been very bullish - extremely so. When it comes to sentiment indicators like this my view is you want to look for extremes and also for when the indicator turns from an extreme...
Bottom line: The TD IMX ticked down from extreme bullish in September.
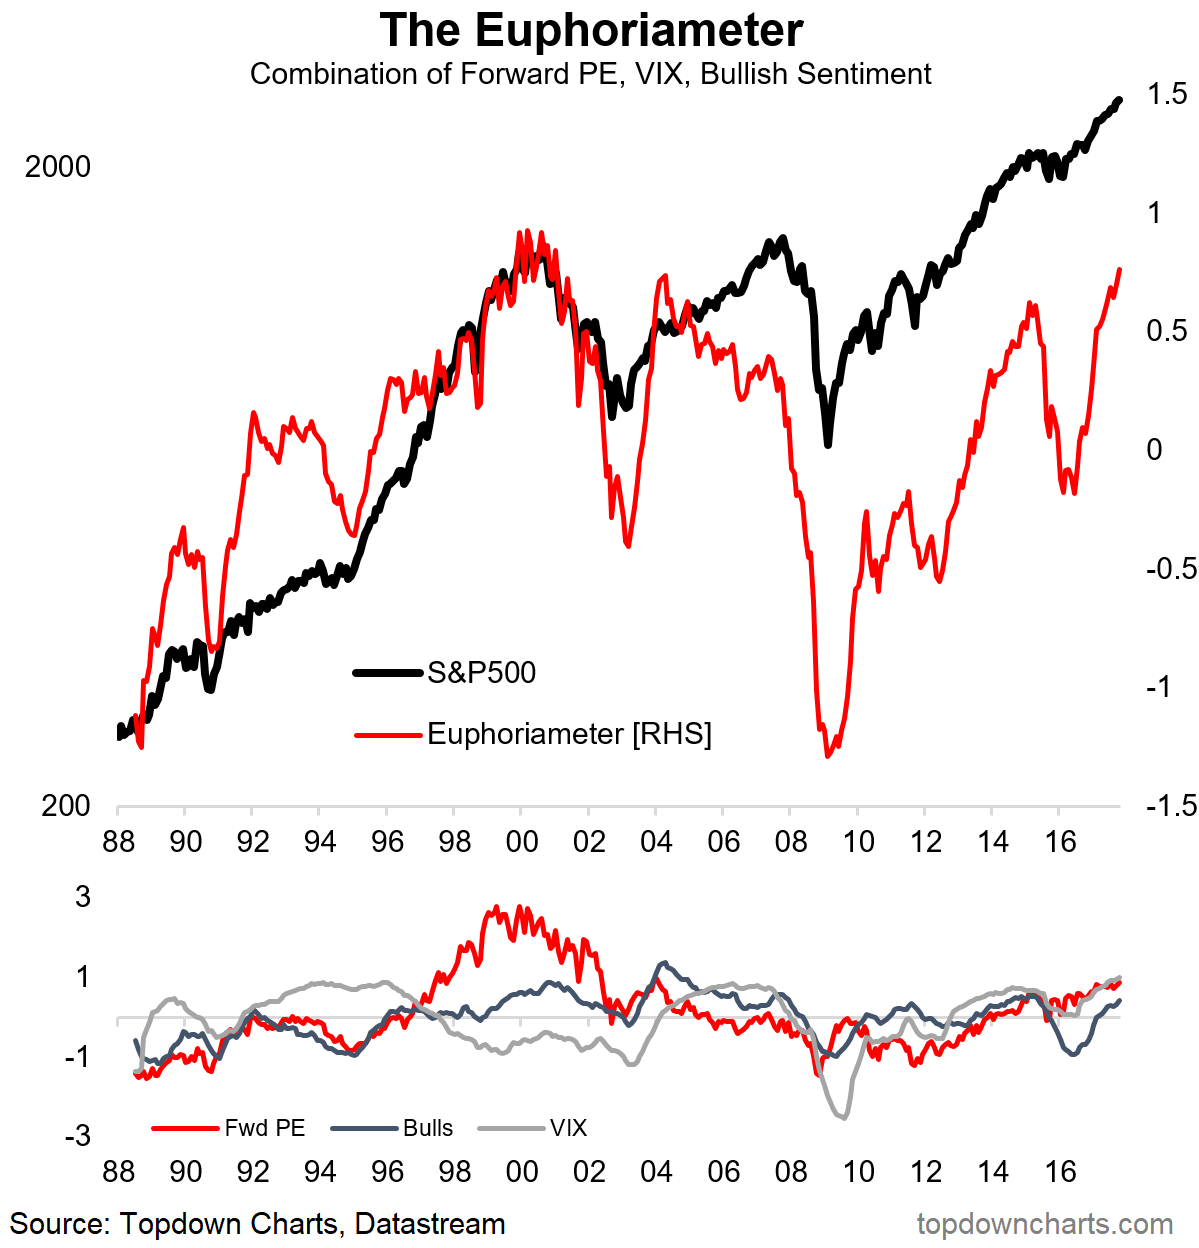
4. The Euphoriameter: The Euphoriameter combines the signals from surveyed bullish sentiment (AAII and II surveys), forward PE ratio valuations, and the level of the CBOE Volatility Index (inverted) to give a composite view of sentiment that isn't reliant on any one type of data. The reason I highlight it this week (note it has a new home on The Weekly Chart Storm website) is that it has reached the highest point since 2000. This is consistent with the later stages of a bull market and there is every possibility that it goes on to match or even exceed the heights of the dot-com boom. However, the risks of a correction or bear market are also steadily rising as the euphoriameter heads higher.
Bottom line: The Euphoriameter has reached the same levels as 2000.
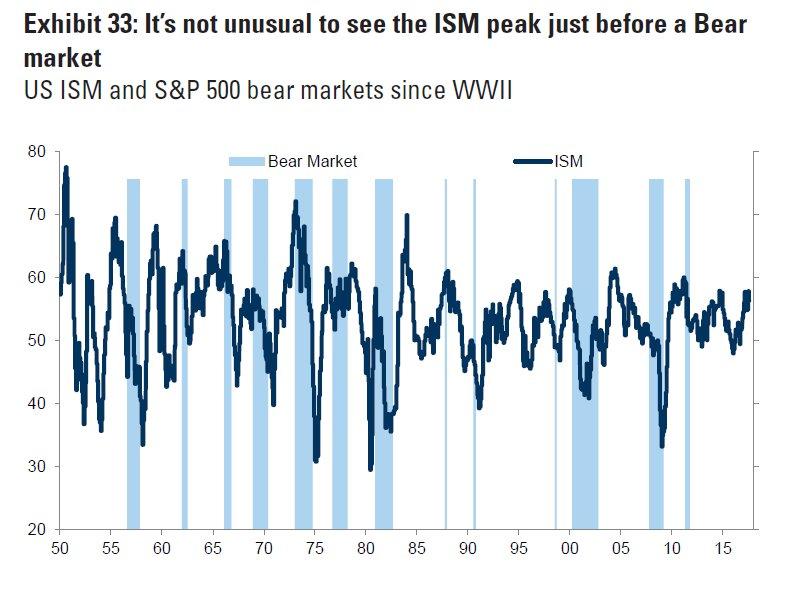
5. The ISM vs. S&P 500 bear markets: This chart shows the ISM manufacturing PMI with S&P 500 bear markets overlayed. As the conclusion in the headline implies; "it's not unusual to see the ISM peak just before a bear market". Although it's too early to call a peak in the ISM PMI, it has spiked to very strong levels in September, and from an economic standpoint, the business cycle certainly looks to be steadily maturing. So it would be reasonable to expect that the market cycle is also maturing (and it often tends to do so with a slight lead on the economics).
Bottom line: The ISM often peaks prior to bear markets due to business cycles and market cycles.
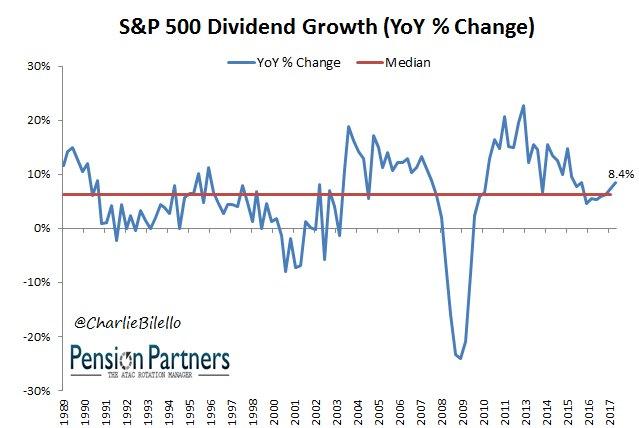
6. Dividend Growth: Good news for income investors, this chart shows annual growth in S&P 500 dividends and growth has just accelerated into the 3rd quarter beyond the long-term median. For income investors, the growth of dividends is just as important if not more important than the actual dividend yield. This chart is one reason why you don't necessarily get fully bearish at this point because there is still ongoing improvement in the fundamentals.
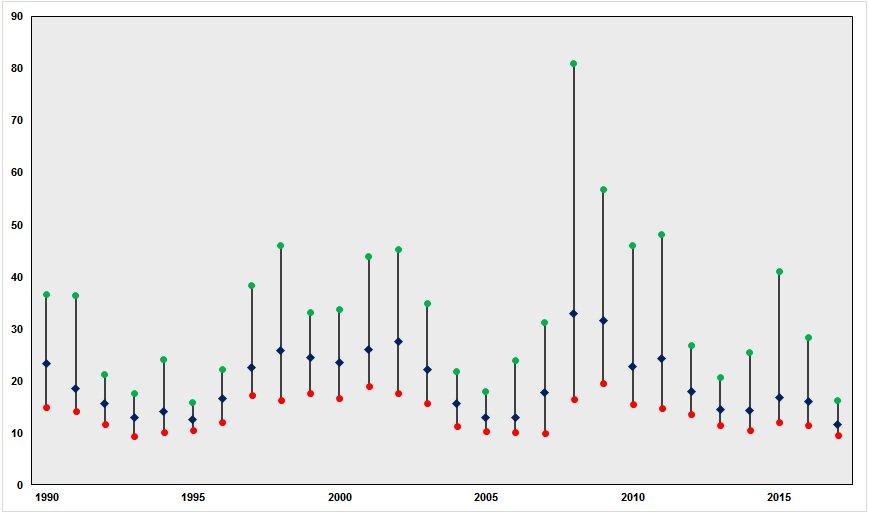
7. Annual average volatility: This chart shows the high (green dot), average (black dot), and low (red dot) for the CBOE Volatility Index (the VIX). The reason for including this one, aside from the chart being an interesting take on it, is that as CBOE states "unless 4Q VIX average is greater than 15.55 2017 will be lowest year on record". So 2017 could end up being the lowest average VIX reading in history!
Bottom line: Implied volatility is low and may end up as a record low in 2017.
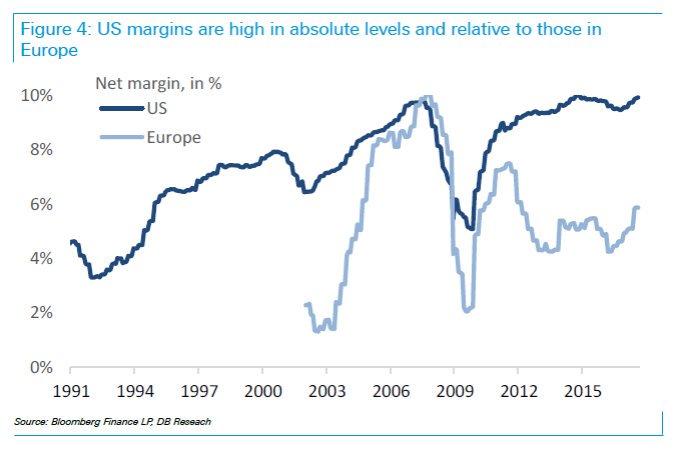
8. Profit margins: Back on the topic of fundamentals, this chart shows the net profit margin for USA vs. Europe. There's a couple of points here, first US profit margins are very strong (and have recovered from the micro-recession in 2015/16), and second US corporates are comfortably outperforming their European counterparts. It's this type of fundamental outperformance that makes it hard for global investors to ignore US equities.
Bottom line: US profit margins are at solid levels.
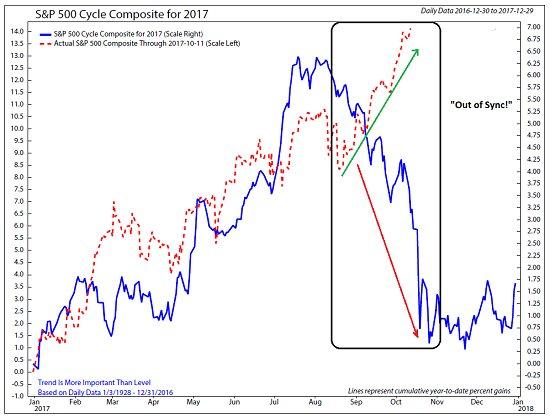
9. Seasonal Cyclicality: Another appearance for this very interesting chart by Ned Davis Research: this chart shows in the blue line the composite cycle signal (combines decennial cycle, presidential cycle, and annual seasonality). There is an interesting divergence, which firstly shows that this type of analysis doesn't always work. But it also raises a couple of questions that I think are worth pondering: 1. Is it actually a good sign that the market is heading higher vs. what the cycle signal suggest? (i.e., "this time is different"); or 2. Is this a bad sign because the market is getting stretched further from the cycle signal? Time will of course tell, as the cliché goes, but I think there is something to question 1 - a refusal to follow the cycle signal reflects the forces in investor sentiment and fundamentals...
Bottom line: The S&P 500 is defying its composite cycle signal, for now.
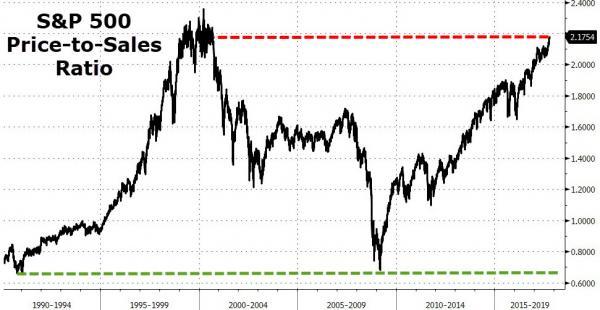
10. Price-to-Sales Ratio: Final chart shows the S&P 500 price to sales ratio. There's a few things to note on this indicator: 1. S&P 500 composition has changed across time, and 2. the level of profit margins have changed across time (and 3. investors receive profits/dividends, not sales as such). That all said, this valuation indicator is at eye-watering levels. Again, despite its short comings, it's another sign of a maturing bull market.
Bottom line: The lofty price to sales ratio is a sign of a maturing bull market.
So where does all this leave us?
This week there's probably 2 categories of interest:
1. Overbought & Overhyped
The signals and charts on the overbought and overhyped front, or aka the signs of a maturing bull market, included the first two charts on the RSI (overbought), the second two charts on investor sentiment (extreme optimism), the VIX (complacency/calm before the storm), and the price to sales (extreme overvaluation).
2. Fundamentals
The strong profit margins chart and the solid growth in dividends goes to show that there is for now a fundamental element to the bull market. As the ISM chart showed, the fundamentals often get the strongest in the final stages of the bull market.
Summary
As the headline noted, the theme of this week is "overbought and overhyped" as the classical overbought signals lined up with "overhyped" signals of extremes in sentiment, complacency, and valuation. But as long as the fundamentals remain sound, the risk of a bear market (vs. a correction or selloff) remain remote.
Disclosure:I/we have no positions in any stocks mentioned, and no plans to initiate any positions within the next 72 hours.
I wrote this article myself, and it expresses my own opinions. I am not receiving compensation for it (other than from Seeking Alpha). I have no business relationship with any company whose stock is mentioned in this article.
