SPX 500 – Bullish Bias, Likely Breakout (4hr chart)
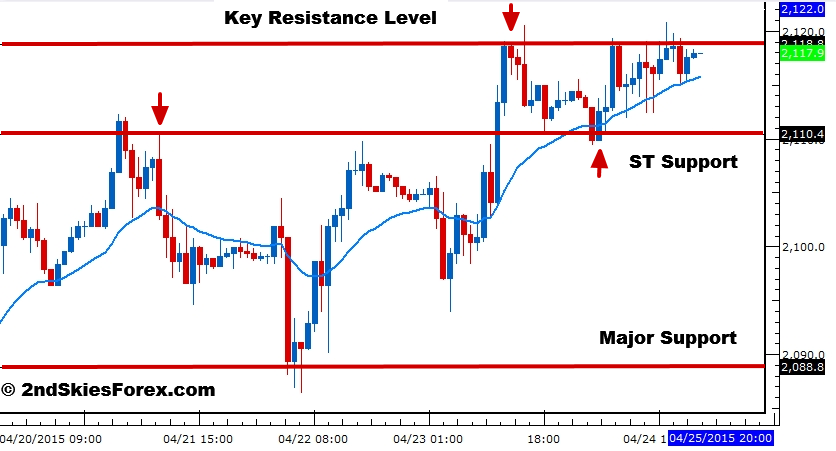
Bought pretty much from the open to end last week, the S&P 500 is looking like it wants to break higher.
ST Support comes in at 2110 and the next major support level below that is 2088, so those are my buy levels. Only a daily close below 2040 negates my bullish bias.
A break and close above 2018/20 puts 2150 into context.

NZD/JPY – Pre-Breakout Squeeze (1hr chart)
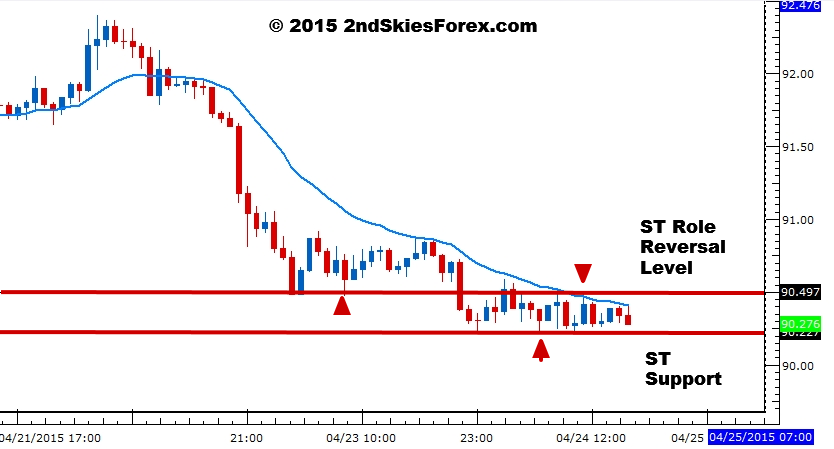
Last week we talked about the impulsive and corrective price action structure in the NZD/JPY, suggesting the next leg is likely down. As you can see from the chart below, this played out exactly as suggested.
What is interesting is the tight consolidation below our key support level at 90.47. This makes it a role reversal level for now.
A pre-breakout squeeze is forming at the moment, so am expecting the next leg also to be lower. The next support comes in at 89.15 so plenty of downside still available.

