The bottom-line is this: if the pattern of the past two years is still driving the market's playbook, then a re-test of recent highs is on the way. Enough extremes in shorter term measures of market stress have been reached in the past two weeks to mark a washout.
The key missing element is time. The down cycles have become increasingly short. This one was less than 2 weeks. Quick falls do little to reset longer term measures of investor sentiment. The market will remain at risk of a more significant fall until investor sentiment is also washed out.
Let's focus first on the positives.
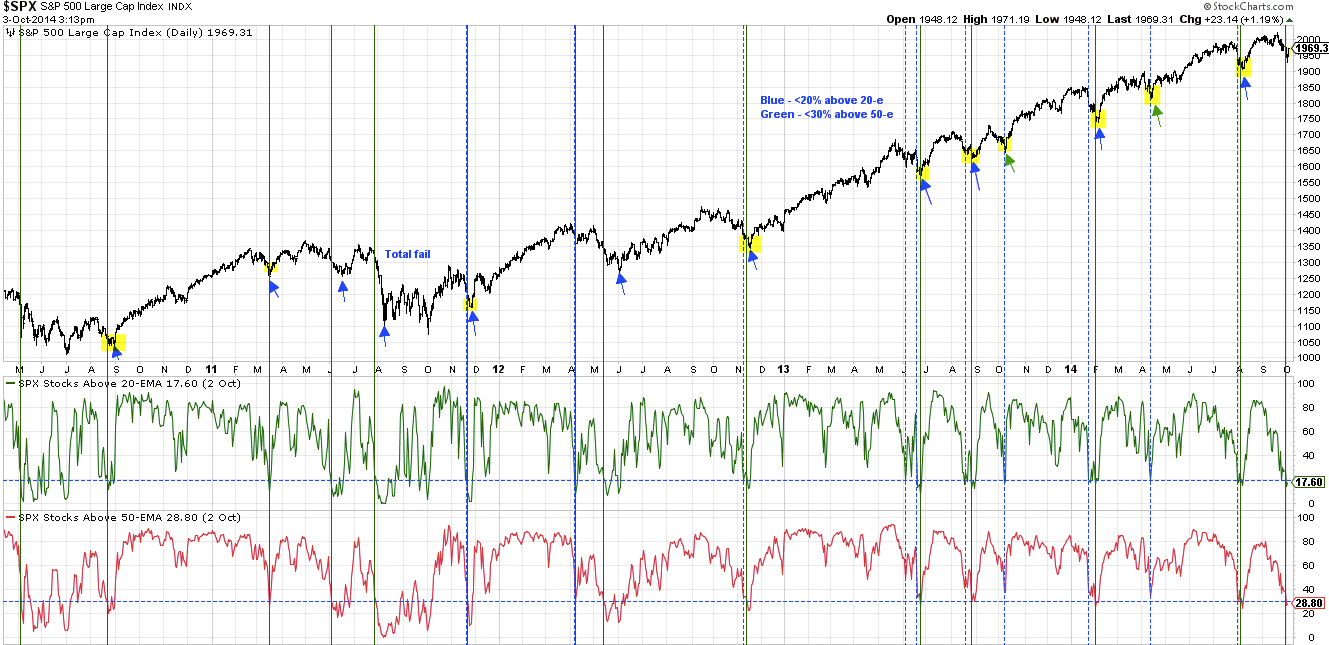
On the mid-week low, less than 30% of the SPX was trading above its 50-ema, and less than 20% was above its 20-ema. These have been washout levels in the past 3 years.
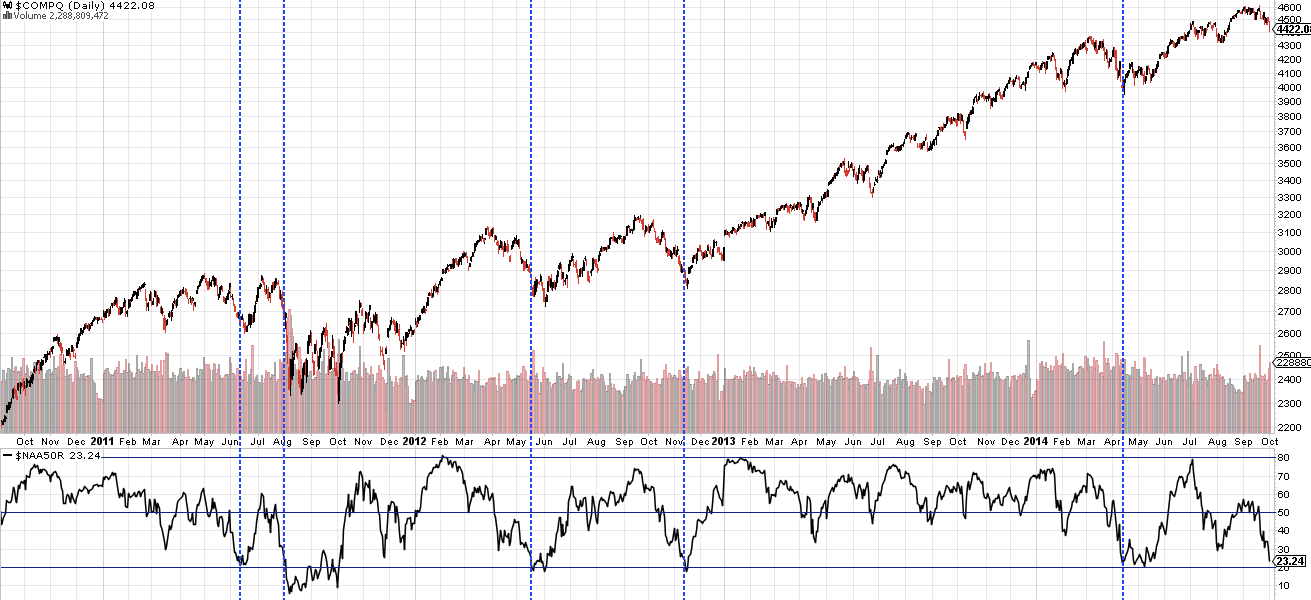
The same is true for the leading NASDAQ index. Breadth hit a low similar to mid-April's.
And the same is true for the troubled and laggard Russell 2000 (RUT). This is where recent bottoms have formed (click here for the chart).
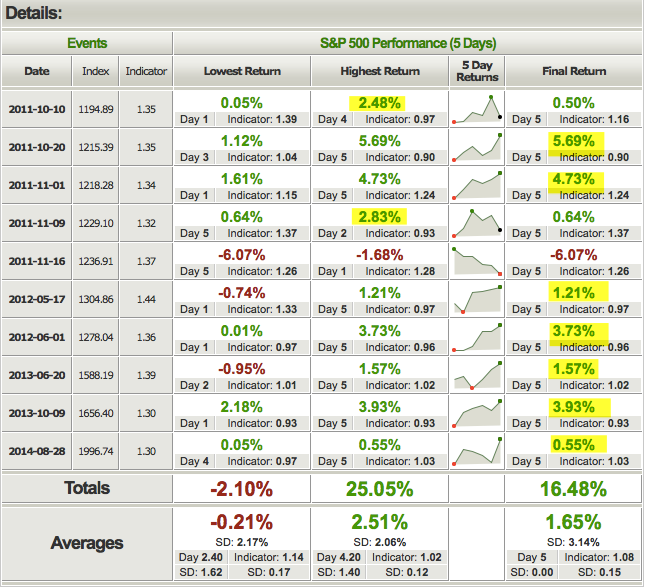
The total put/call ratio spiked to 1.3 this week. That also has been an extreme where the market has formed a bottom in the past 3 years. Note how 2011 continued down further. The same was true in 2010.
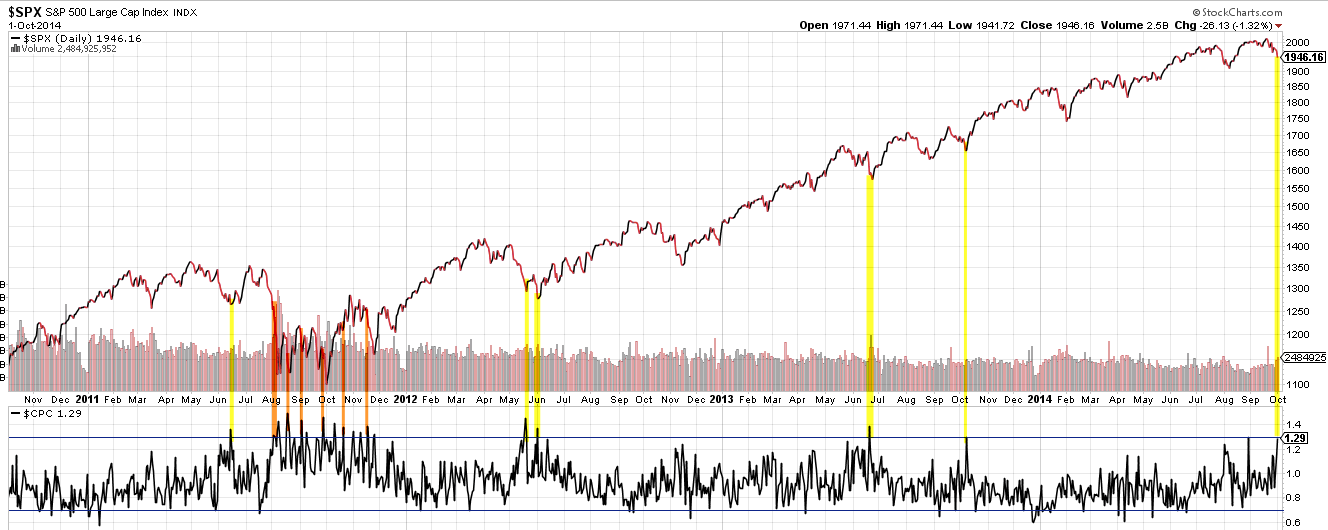
The number of instances is low but, with one exception returns have been very favorable over the following week, after similar spikes in put/call. The table below is all put/call spikes above 1.29 in the past 3 years.
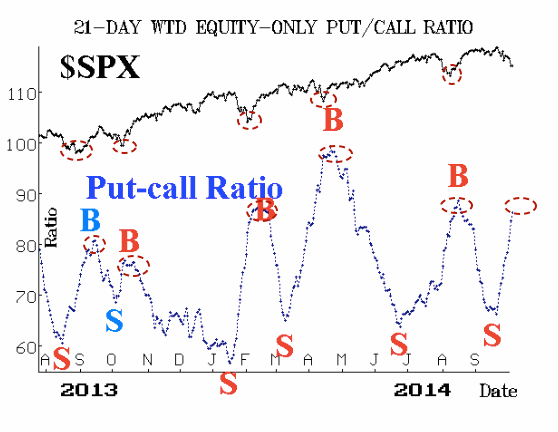
The 21-day weighted moving average put/call is now where recent bottoms (except one) have formed (chart from McMillan).
The strong sell-off this past week closed 3 open gaps in SPDR S&P 500 (ARCA:SPY) from the August low and pushed the index to its October monthly S2 level. The last time a monthly S2 was hit was the February 3 low.
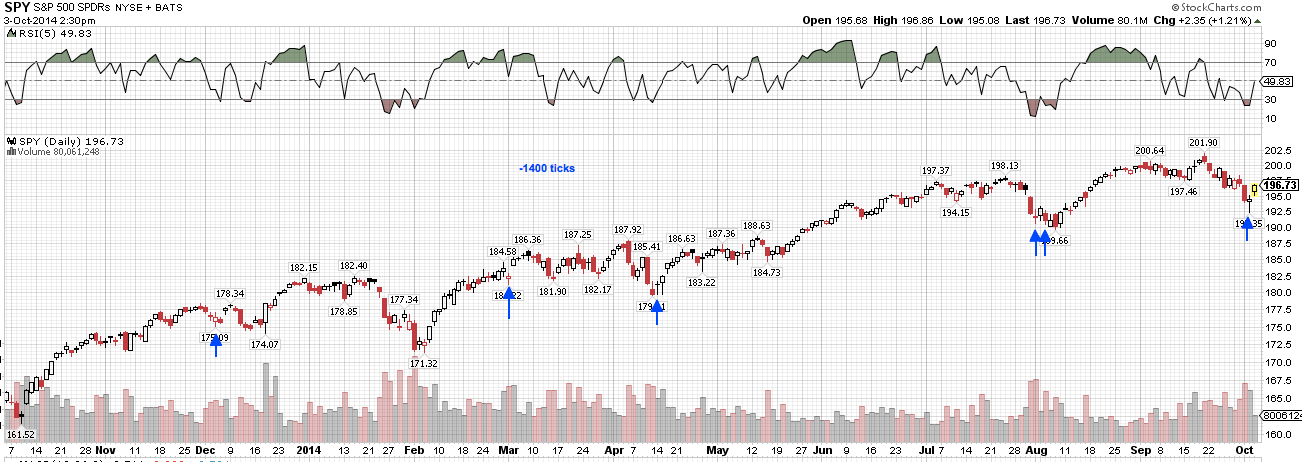
The ferocious selling Thursday morning produced a -1400 tick. That is a blow-out that can often mark a capitulative low. The chart below shows similar extremes in tick in the past year.
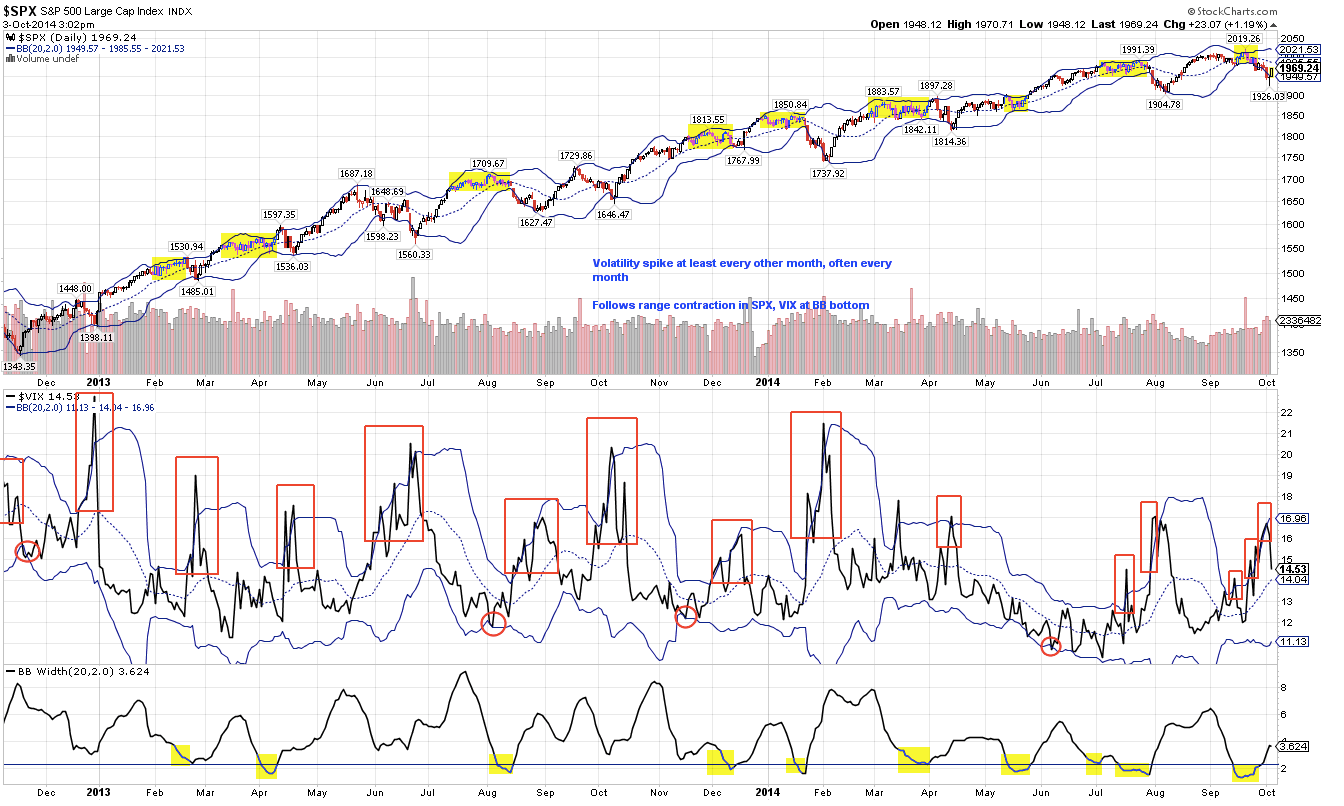
A compression in the SPY trading range has, in the past, resulted in two spikes higher in volatility in the weeks ahead which have, in turn, marked a low. That has now happened again and VIX also reached 18, an area from which recent rallies have started.
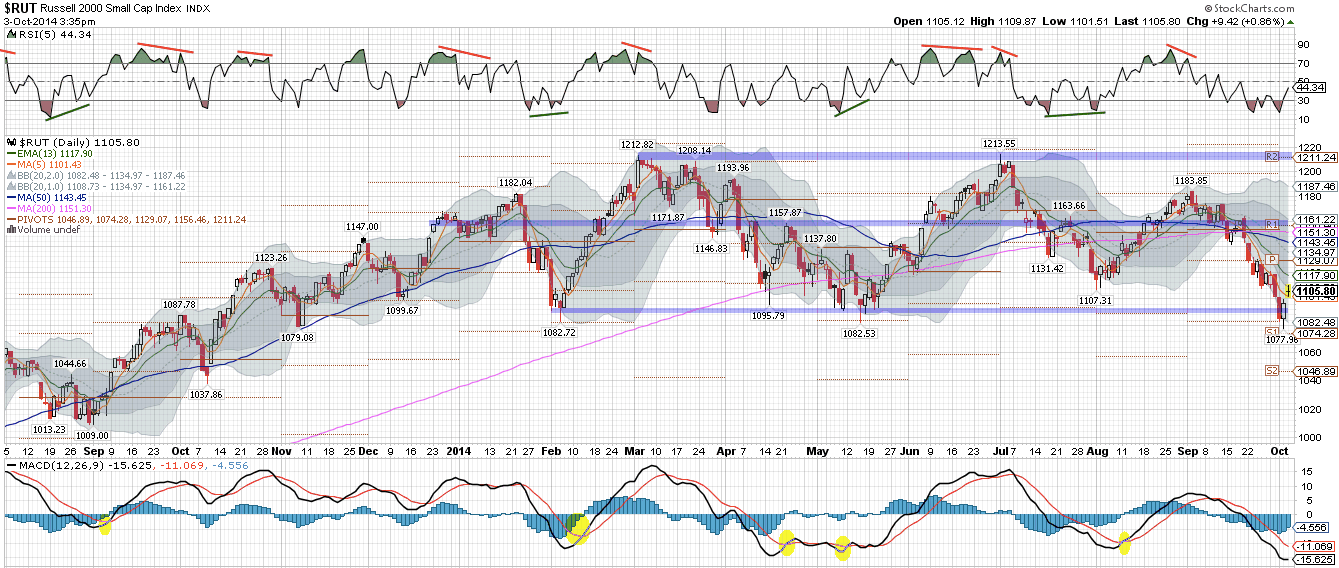
The weakest index has been RUT and it recovered right on its major support level from the past year. That level (1080) now assumes tremendous importance; if it is revisited again in the next few weeks, the odds are high that it fails and a 10% further correction ensues (post). The trend, to be perfectly clear, is horrible, with even its 200-dma in decline. There is a clear lower high (September vs July) and lower low (October vs August); that is the definition of a downtrend. It is not a healthy index.
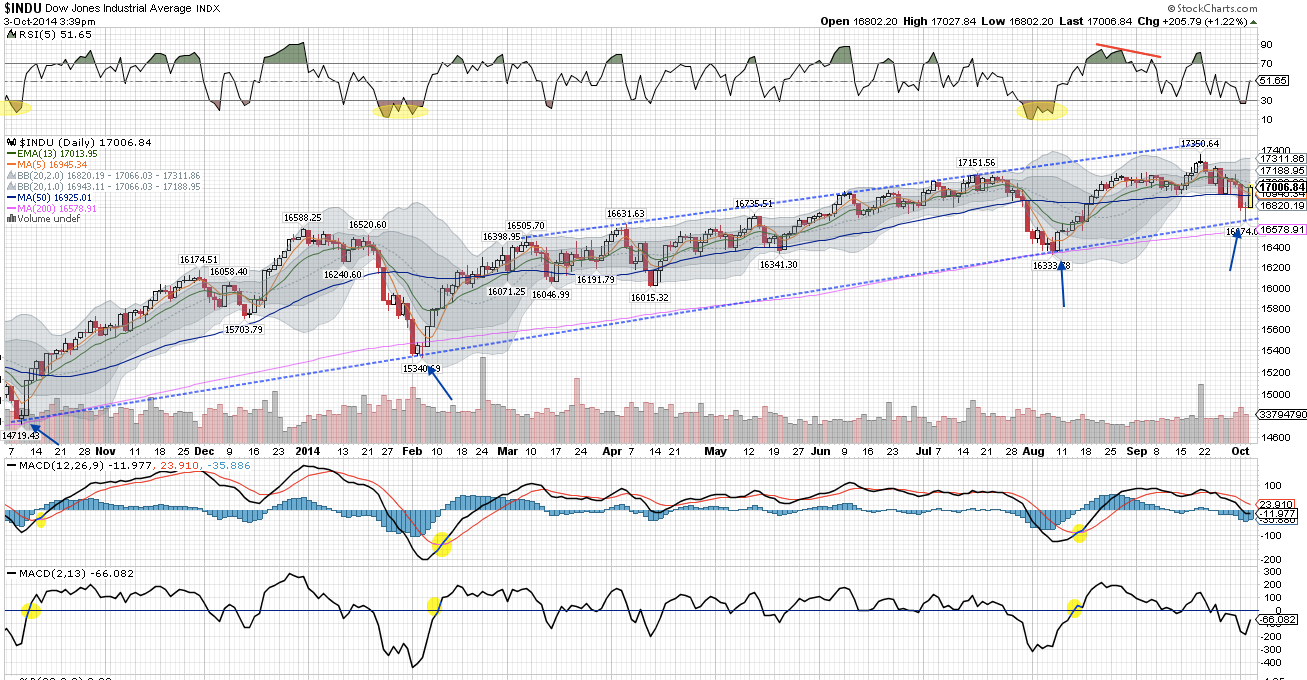
The Dow recovered right on its long term trend line. There was no foul. Note how its 50-dma is flat; the trend is weakening. A revisit to this week's lows will likely lead to a break and re-test of the August pivot 4% lower. Crucially, this level is now below its 200-dma.
The 20-wma on the weekly SPY chart that we showed last week held. That has been the pattern since November 2012 (arrows). As we said then, should it close below the 20-wma, the first test of the lower Bollinger® (now at the 189 area) in 22 months is likely (past instances are shown with circles). This means holding above 195 in the weeks ahead is key. For now, the recent pattern continues.
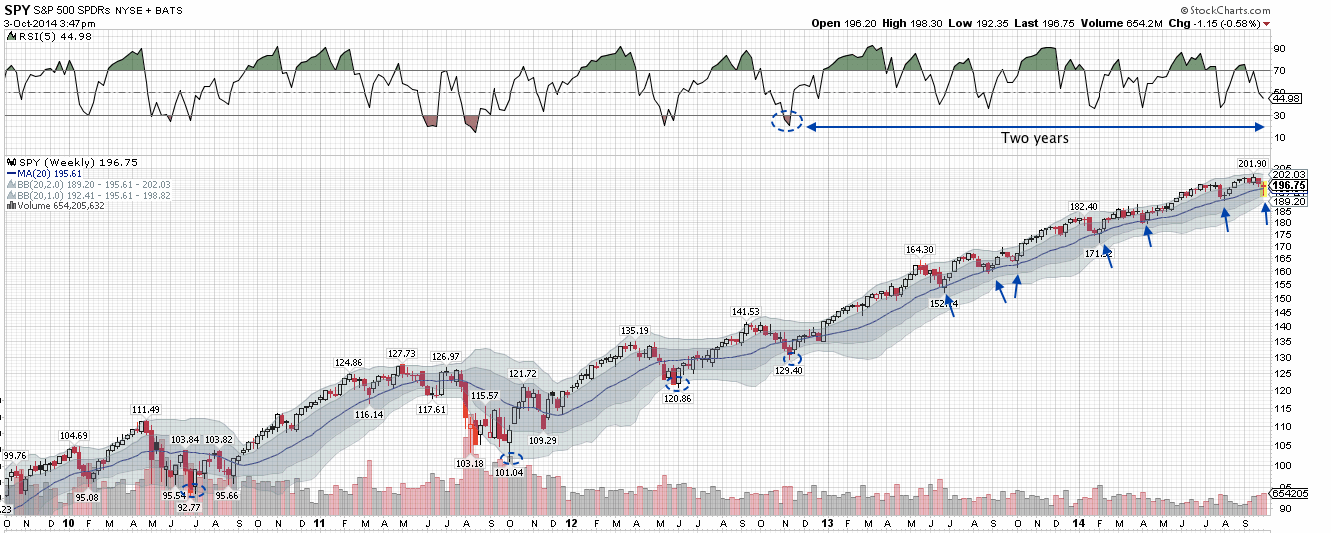
What is noteworthy about the chart above is how long the weekly RSI (top panel) has held above 30. In the 2003-07 bull market, RSI became oversold every 8 months or less. In the 1990s, it was generally less than a year. In comparison, it has now been two full years since RSI was less than 30. From an historical perspective, a larger decline is well past due.
This raises an important point about what this week's low is missing: time. The pattern over the past two years has been for every correction to become shorter and more shallow. The last correction that went more than a month was October-November 2012, two years ago.
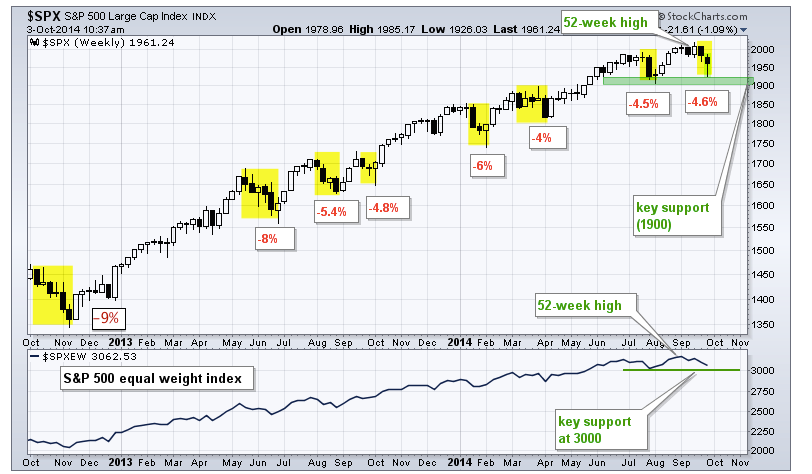
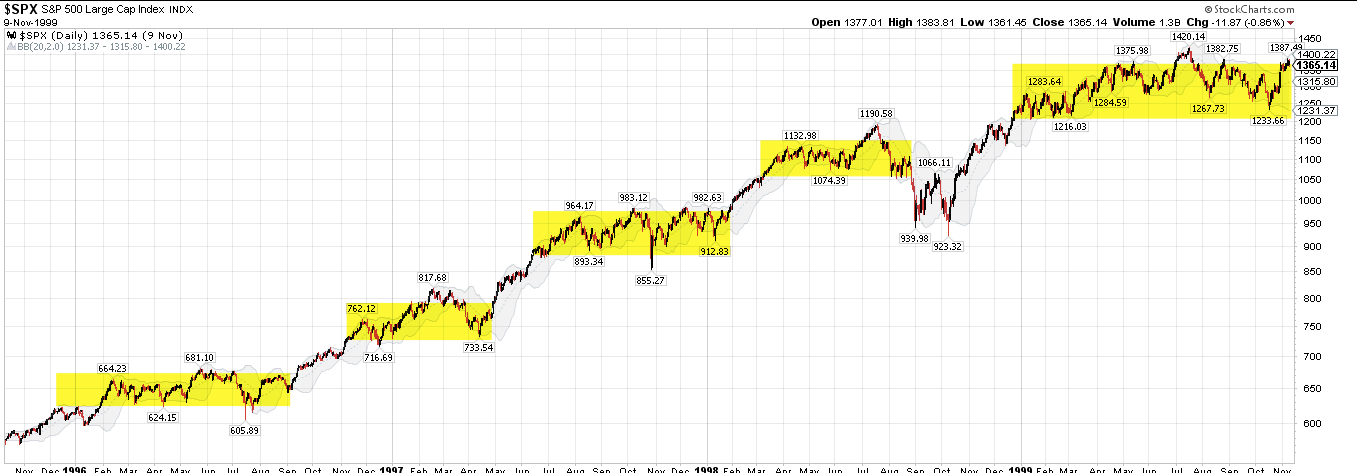
Time as much as price is responsible for resetting investor expectations. The often forgotten feature of the 1990s bull market is the long periods where price moved sideways, shaking out weak longs and setting up the next leg higher in the rally.
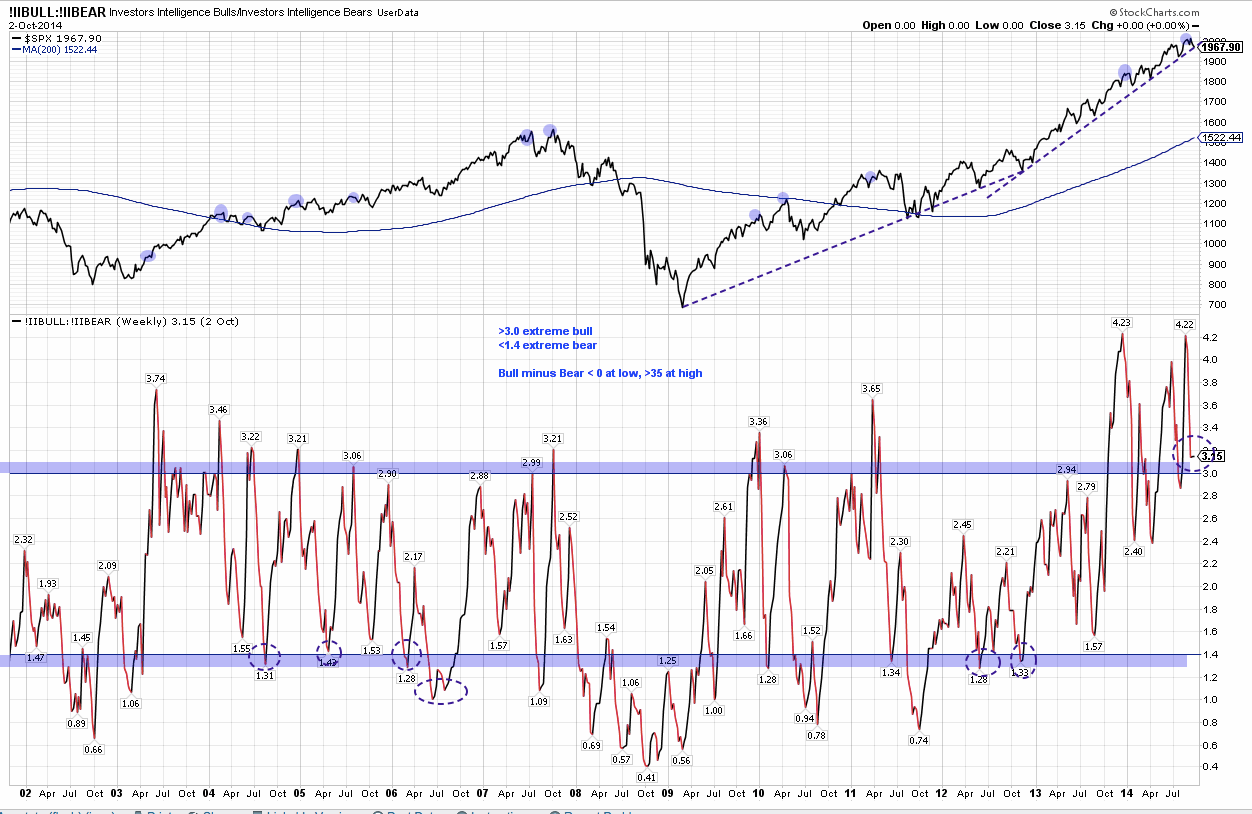
In comparison, bullish sentiment (and asset allocation) have been high since late 2012. This past week, there were more than 3 times as many bulls as bears. That ratio would regularly dip below 1.4 times in both of the prior bull markets. A longer correction to reset investor expectations and thereby set up the next leg higher in the market is overdue.
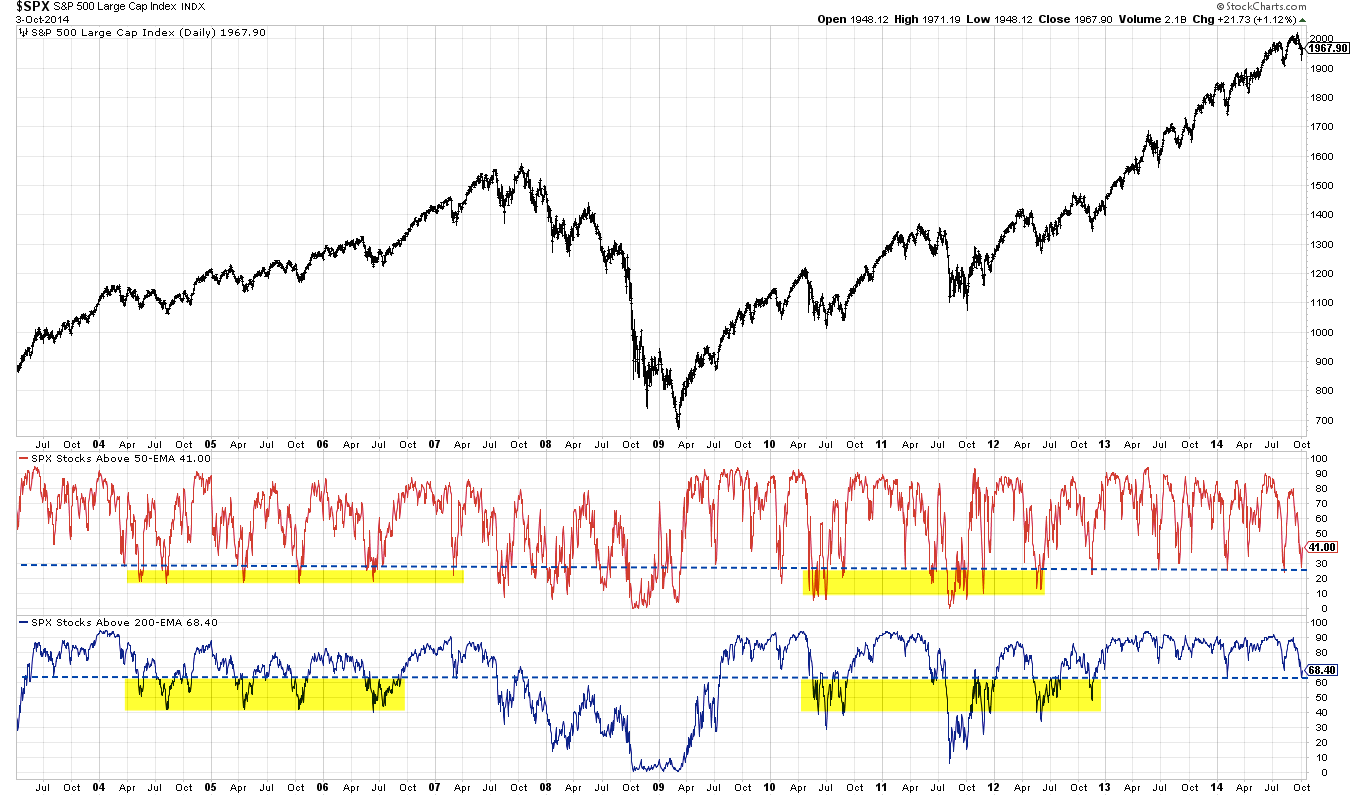
While the breadth wash out this past week was comparable to recent lows, it was mild relative to lows during prior bull markets and prior to 2013. Every year of the 2003-07 bull market produced a washout where less than 40% of SPX stocks traded above their 200-ema (lower panel). Today that number is 68%. A true washout in breadth is still missing.
From an Elliot Wave (Caldaro, not Prechter) perspective, a larger fall would imply that SPX is starting a Primary 4 correction within a bull market. A Primary wave correction typically lasts 2-3 months and involves a loss of 15-20%. That would imply that SPY is headed to its February low (171). Read more here.
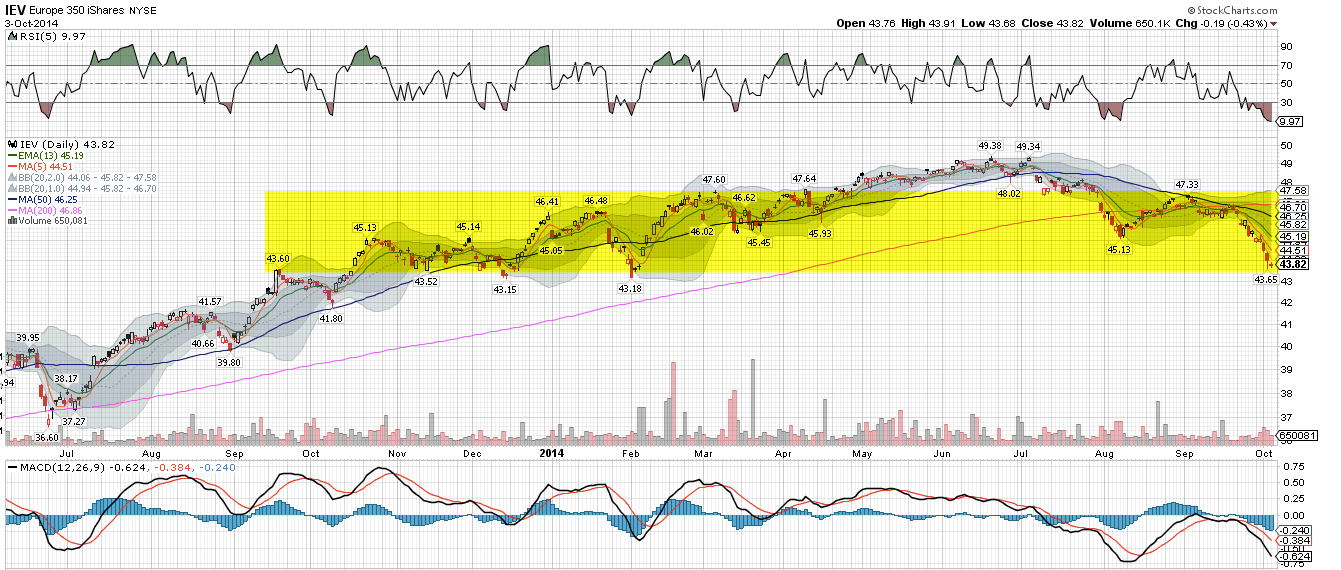
If that sounds unlikely, consider that the All World Ex-US index (NYSE:VEU) has already lost 10% and the Euro 350 (NYSE:IEV) has lost 12% and is now trading on its February low.
While we would focus on a repeat of the recent pattern off of oversold levels, it's possible that the current rebound falters. October is an historically rocky month for equities. Since the 1970s, the pattern has been for October to gyrate wildly and revisit early lows later in the month (chart from Tom McClellan).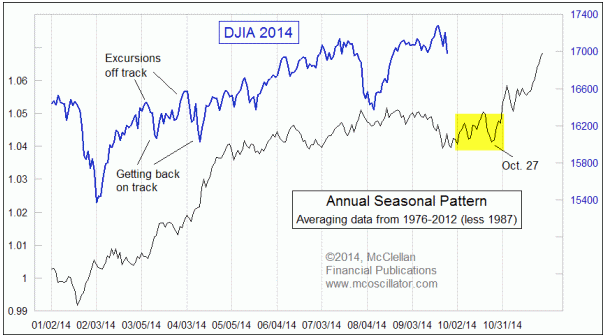
Supporting that feature of October is this: SPY has declined two weeks in a row from a high. In the past 5 years, the lows of the second week have been revisited in the weeks ahead. In the chart below, the yellow shading is every two week decline from a high since 2009. A blue arrow indicates a lower low in the next 4 weeks; a green arrow indicates a low retest the following week. All of the green arrows were eventually undercut with a lower low in the following two months. In other words, there has always been a lower low ahead.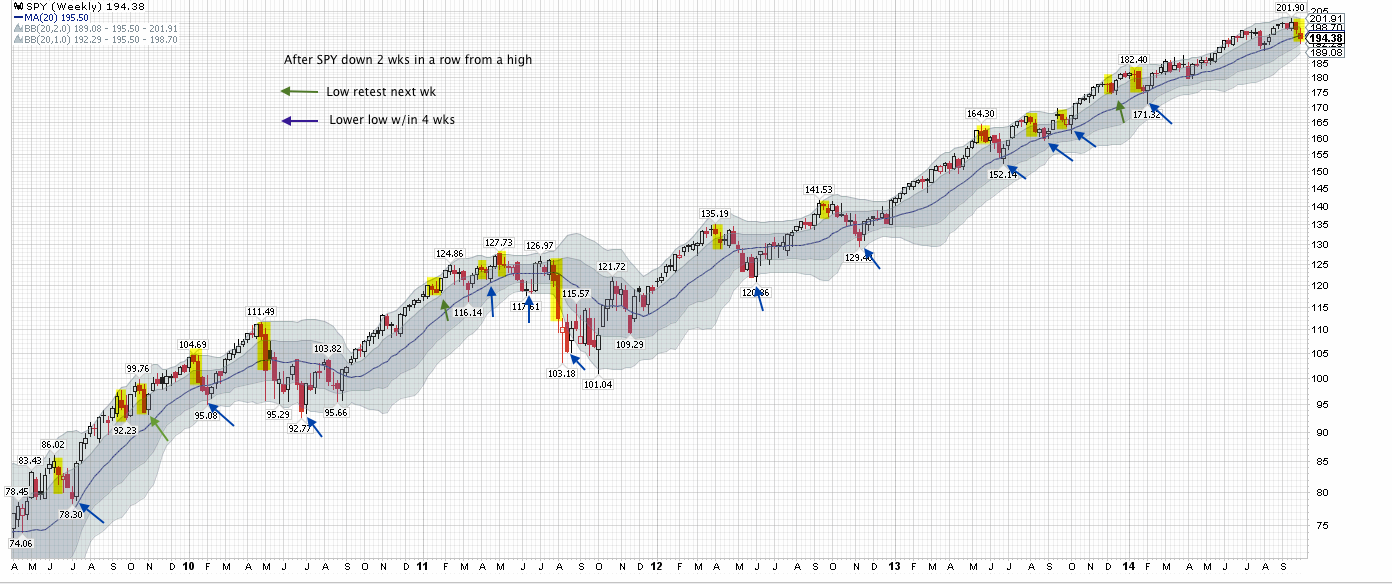
While SPY formed a reversal candle on Thursday and had a follow through on Friday, the intermediate trend is still weak. The 13-ema is still falling; SPY will need to regain and hold above 197 in order to turn the slope positive. The vertical lines in the chart below are instances in the past two years where the 13-ema has resumed positive slope after a sizable drop. In this case, a positive 13-ema would imply that SPY has also regained its important 50-dma.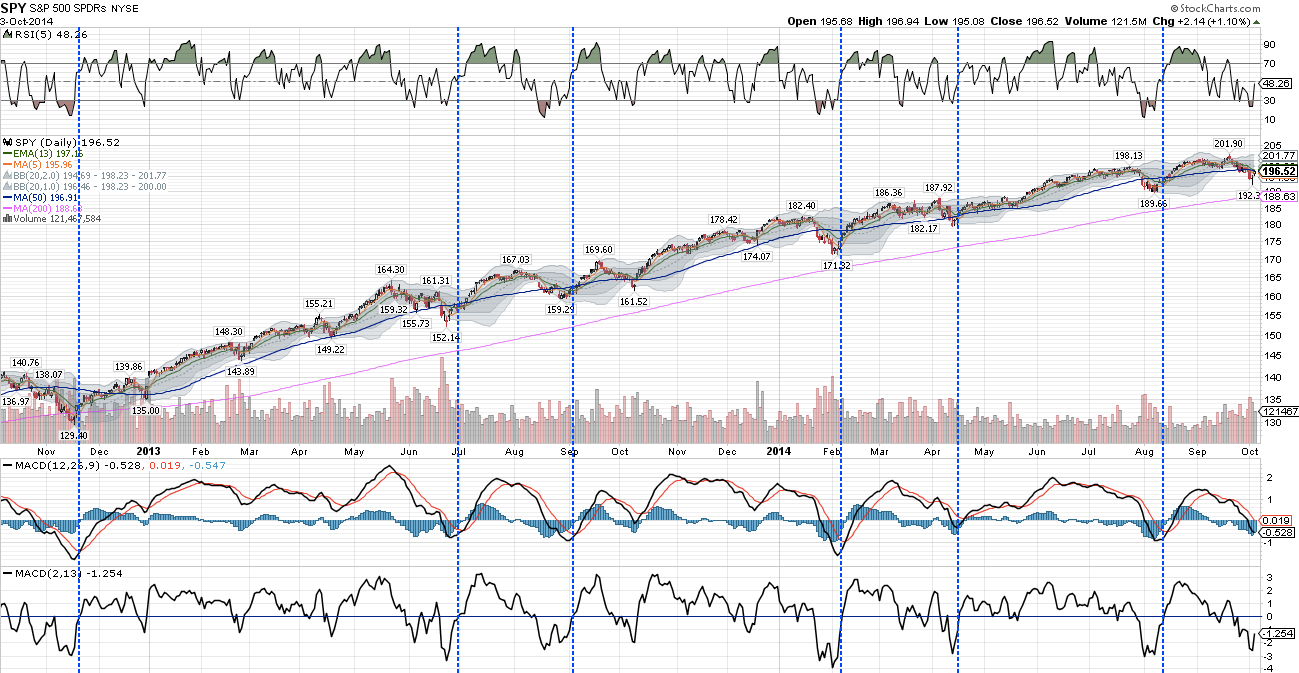
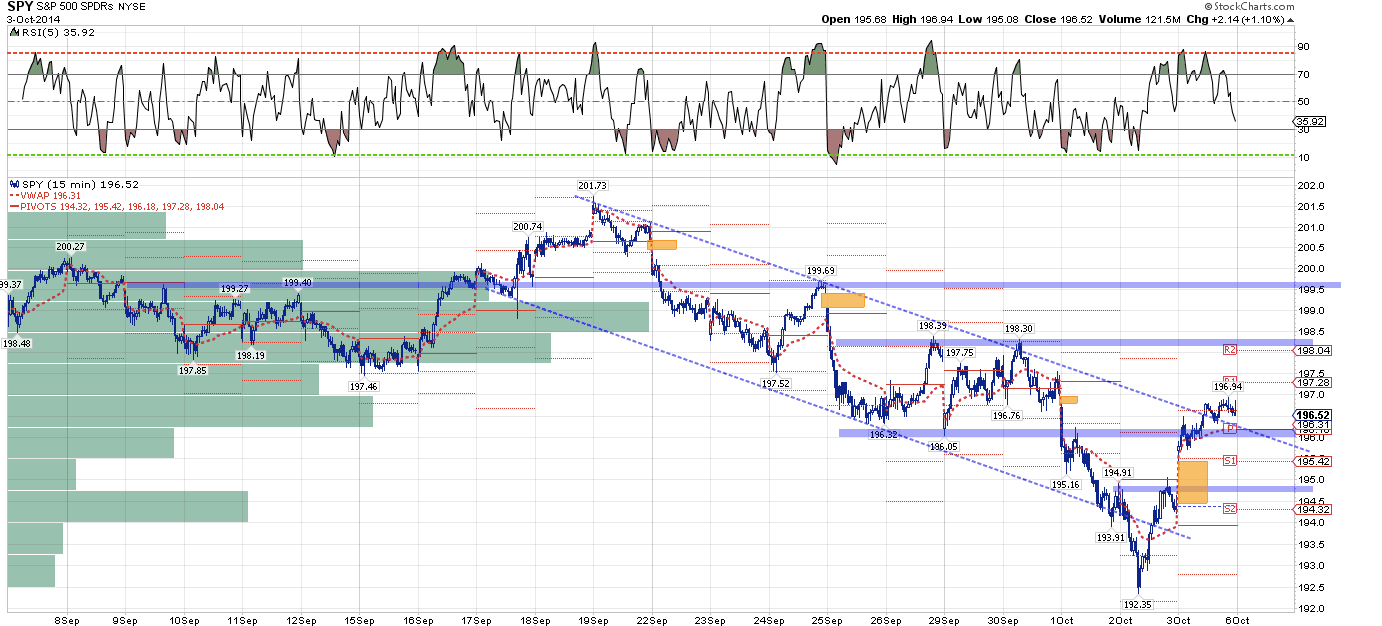
SPY broke out of its two week down channel. The rebound puts SPY back in its July trading range, between 195.5 and 198.3. The lower bound is also next week's pivot. Losing that level opens up a risk of filling Friday's gap (194.4). There's an inverted head and shoulders pattern that projects to the upper bound. Exceeding 198.3 would be significant as it would constitute a higher high and further confirmation of a trend reversal. Weekly R1 is 199.1, also the location of an open gap.
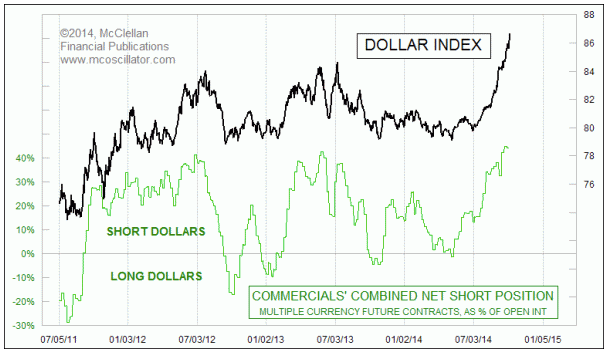
Finally, as a follow up to last week's post, the dollar index has moved even higher. Commercial traders (smart money) have moved to a 15 year high bet against the dollar. This has implications for commodities, especially energy, and emerging markets, which are inversely correlated to the dollar. The chart below is from Tom McClellan who adds, "commercial traders are often early in adopting a lopsided position, but they are nearly always proven to be correct."
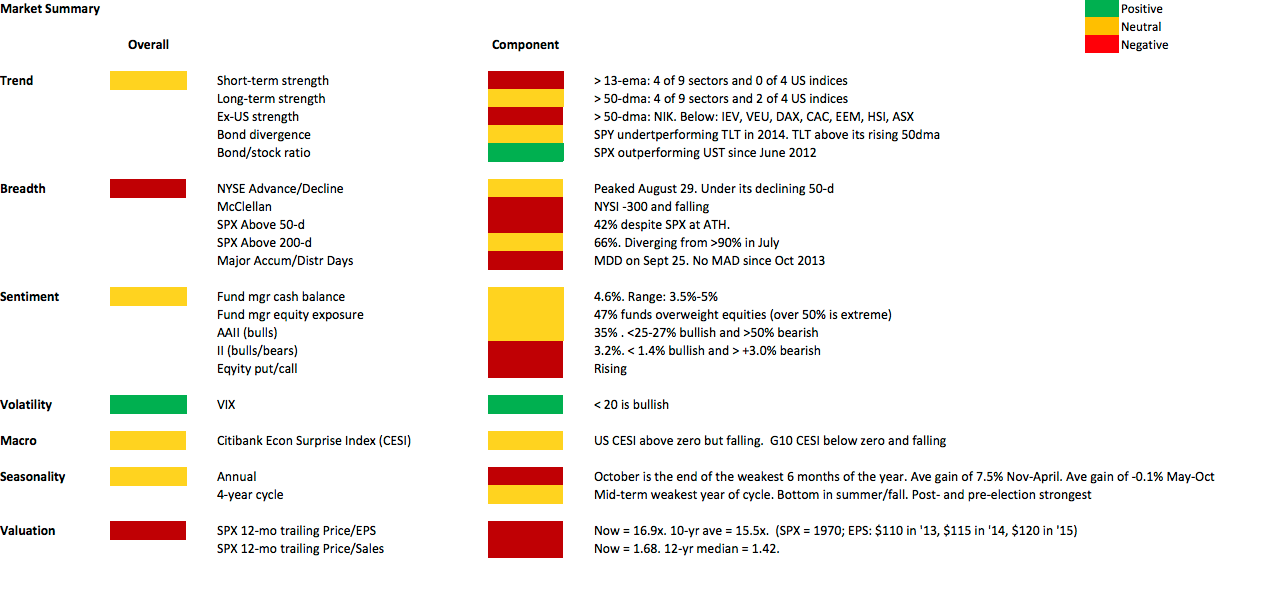
Our weekly summary table follows.