The S&P 500 finished higher by 1.21% last week, Small Caps (iShares Russell 2000 Index (ARCA:IWM)) finished up 0.79% and International stocks (iShares MSCI Eafe Index Fund (ARCA:EFA)) closed out the week up 1.00%. Even though we got a negative GDP print, it seems traders are little concerned about any potential macro weaknesses in the economy and just want to see higher equity prices.
SentimenTrader made an interesting point on Friday with the S&P closing out the month of May at a new one-year high:
“since 1928, it has managed to do so 7 times. The first week of June showed a positive return only 1 time, and the entire month of June was positive 2 of the 7 times. The years were 1944, 1950, 1959, 1963, 1990, 1995, and 2007.”
Trend
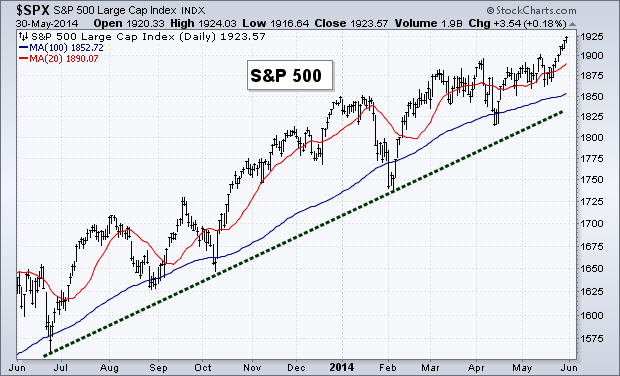
As we continue to hit new highs, the trend in the S&P 500 is of course up. We remain above our short-term and intermediate-term moving averages, the 20-day and 100-day MAs as well as the rising trend line off the previous lows.
Equity Breadth
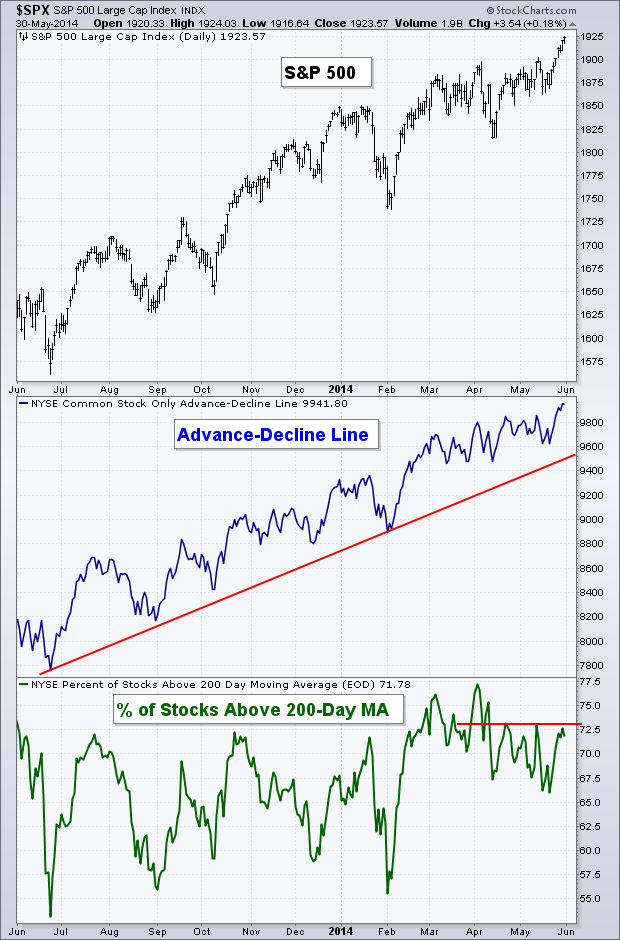
We saw a fair amount of positive movement in breadth last week, with the Common Stock-Only Advance-Decline Line hitting a new high, confirming the move that’s taken place in the underlying index. The Percentage of Stocks Above Their 200-Day MA has also come off its low and is attempting to set a higher high above its previous May high of 72.5%.
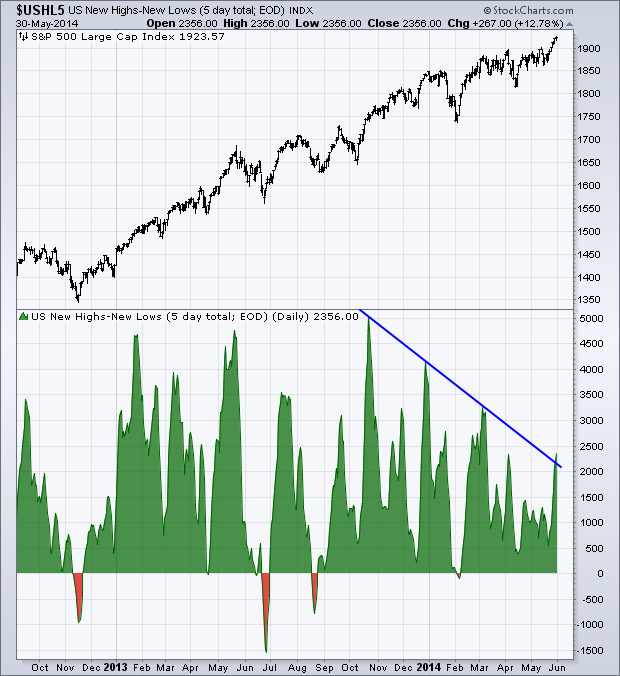
The net number of new highs vs. new lows, a chart I’ve discussed a handful of times this year as a sign of weakening breadth, has also shown signs of improvement. This 5-day total measure of breadth has broken its down trend of lower highs since its peak last October. This is a move in the right direction for the market to begin seeing some healthy internals for the current, aging, bull market.
Equity Momentum
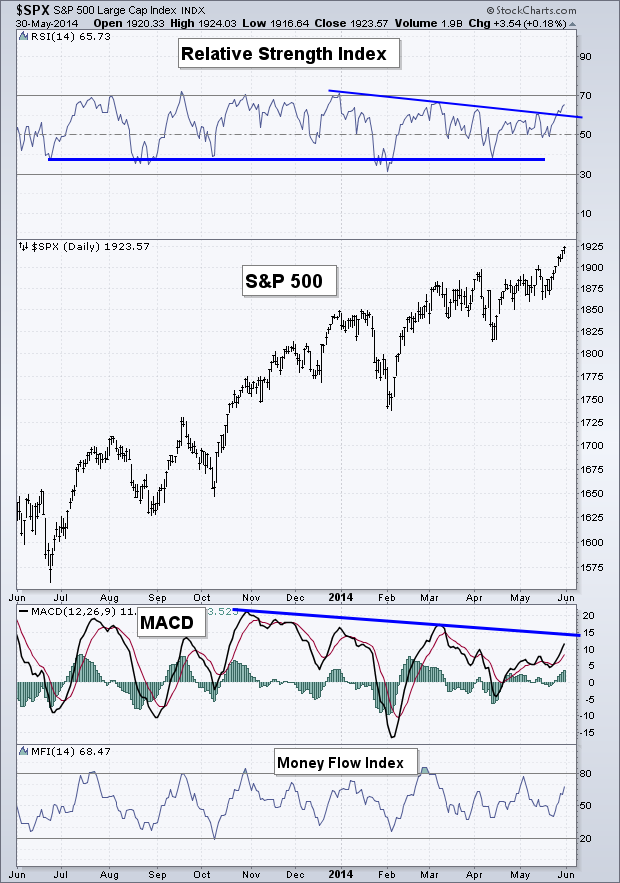
For the bulk of 2014 I’ve been discussing the negative divergence that’s been happening in both the Relative Strength Index and the MACD. Last week we saw the RSI break above the falling trend line after holding on to the 50 level. While the MACD is still making lower highs, it is rising and may try to play catch-up this week or next.
Crude Oil
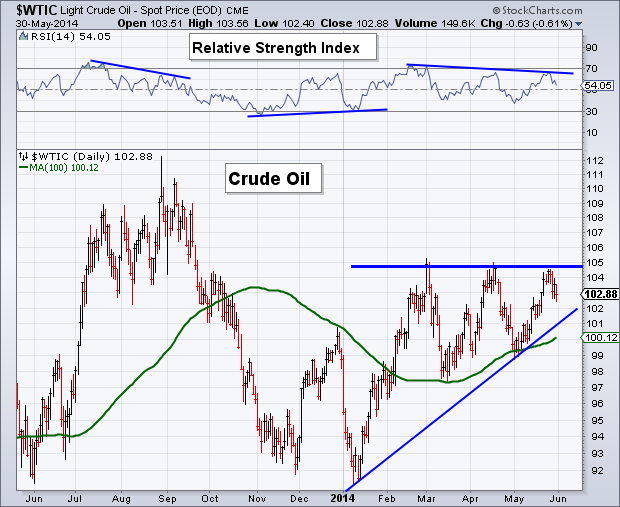
Last Thursday I wrote a post about the relative performance between Crude Oil and Gold. Today I want to look at just Crude Oil. Since March, the $105 level has been resistance, and is just about where price finished up on Friday. With each attempt to break $105 in oil we’ve seen a lower a negative divergence develop in the Relative Strength Index. Prior to the Sept ’13 peak and the January ’14 low, divergence in momentum was taking place. I’ll be watching the rising trend line off January and May lows to if that eventually gets broken as we progress into the summer.
Bonds
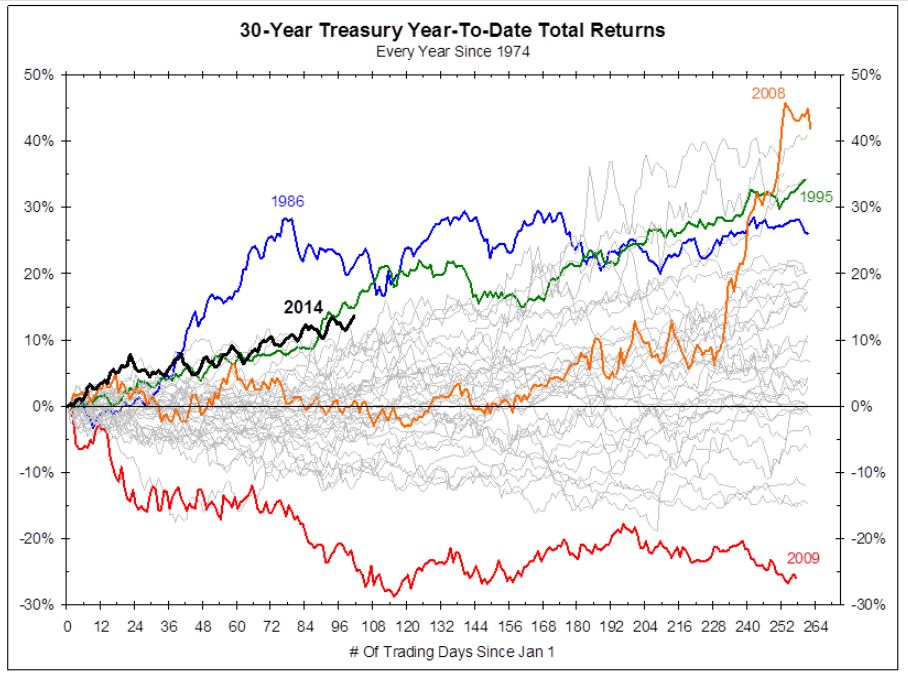
On Friday we saw the 10-Year Treasury Yield hold on to its October ’13 low as well as its 200-week Moving Average. Below is an interesting chart from Bianco Research of the current 30-Year Treasury YTD performance compared to past years. As you can see, since 1974, the best year for 30-Year Treasurys was 2008. While many traders and pundits are saying that bonds have run too far too fast while equities slowly crawl to new highs, a few basis points at a time. However as the chart below shows, we saw much stronger bullish action in 1986 and 1995 by this point in the year, and both instances saw bonds continue to gain into year-end. While bond yields may be sitting at support right now, the historical context shows that it’s POSSIBLE for bonds to continue to rally. We’ll see if they do.
60-Minute S&P 500
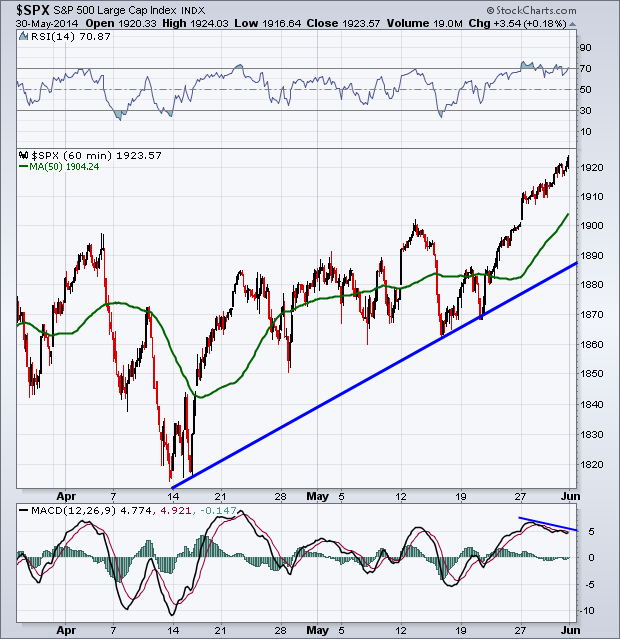
The S&P has continued to make higher highs as the index rides above its 50-1hr Moving Average. The RSI indicator has been staying right around the 70 level, a sign that bulls are firming in control on this intraday chart. However, we do have a slight negative divergence in the MACD indicator in the third panel of the chart below.
Last Week’s Sector Performance
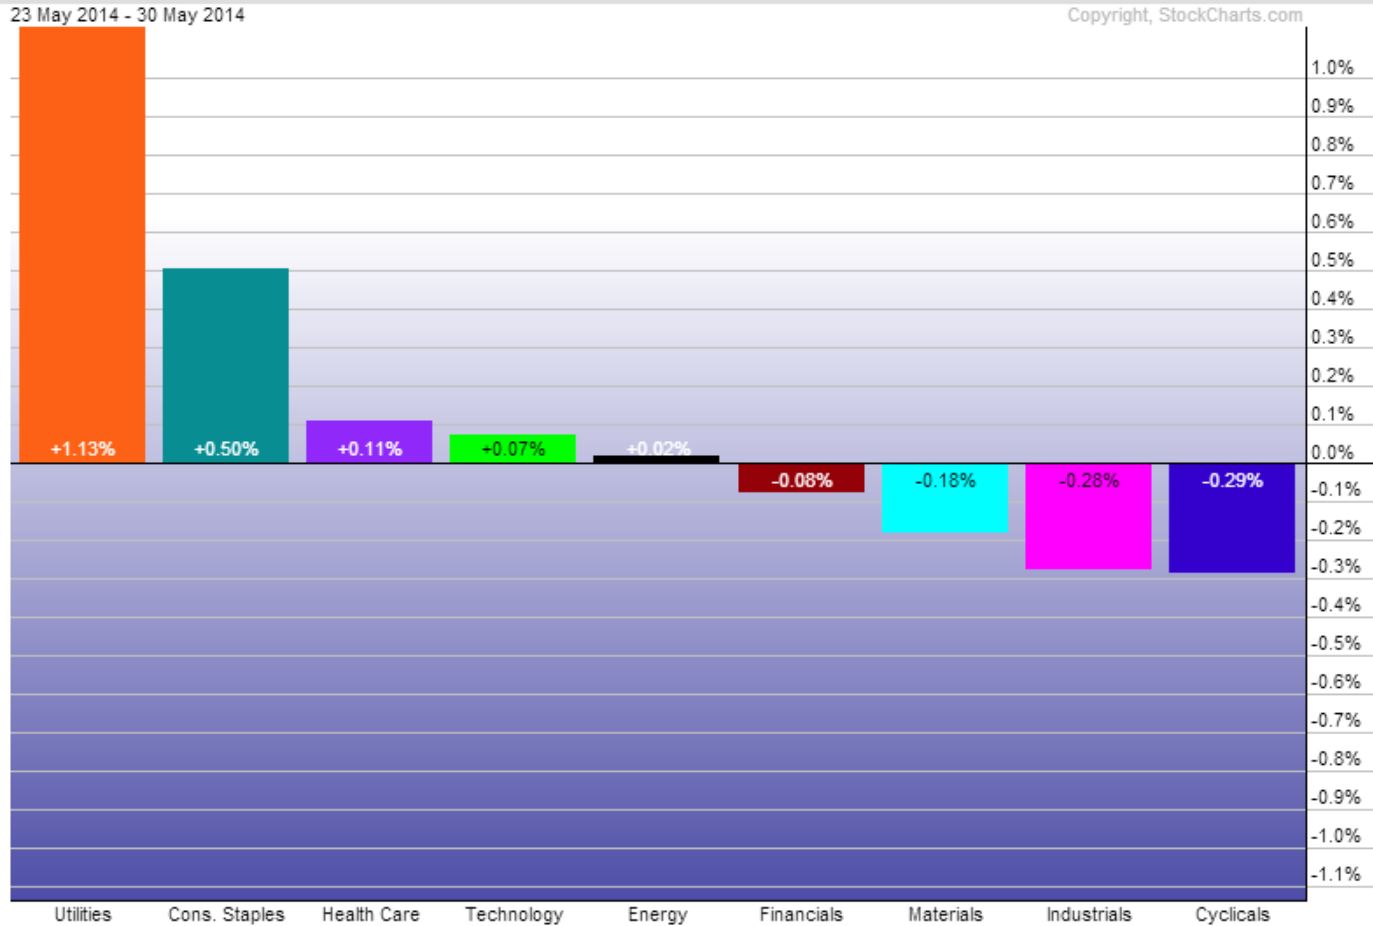
After a few weeks of under-performance, Utilities (SPDR Select Sector - Utilities (NYSE:XLU)) came back last week as the best relative performance sector. Utilities was followed by Consumer Staples (SPDR - Consumer Staples (ARCA:XLP)) and Healthcare (SPDR - Healthcare (ARCA:XLV)).
Year-to-Date Sector Performance
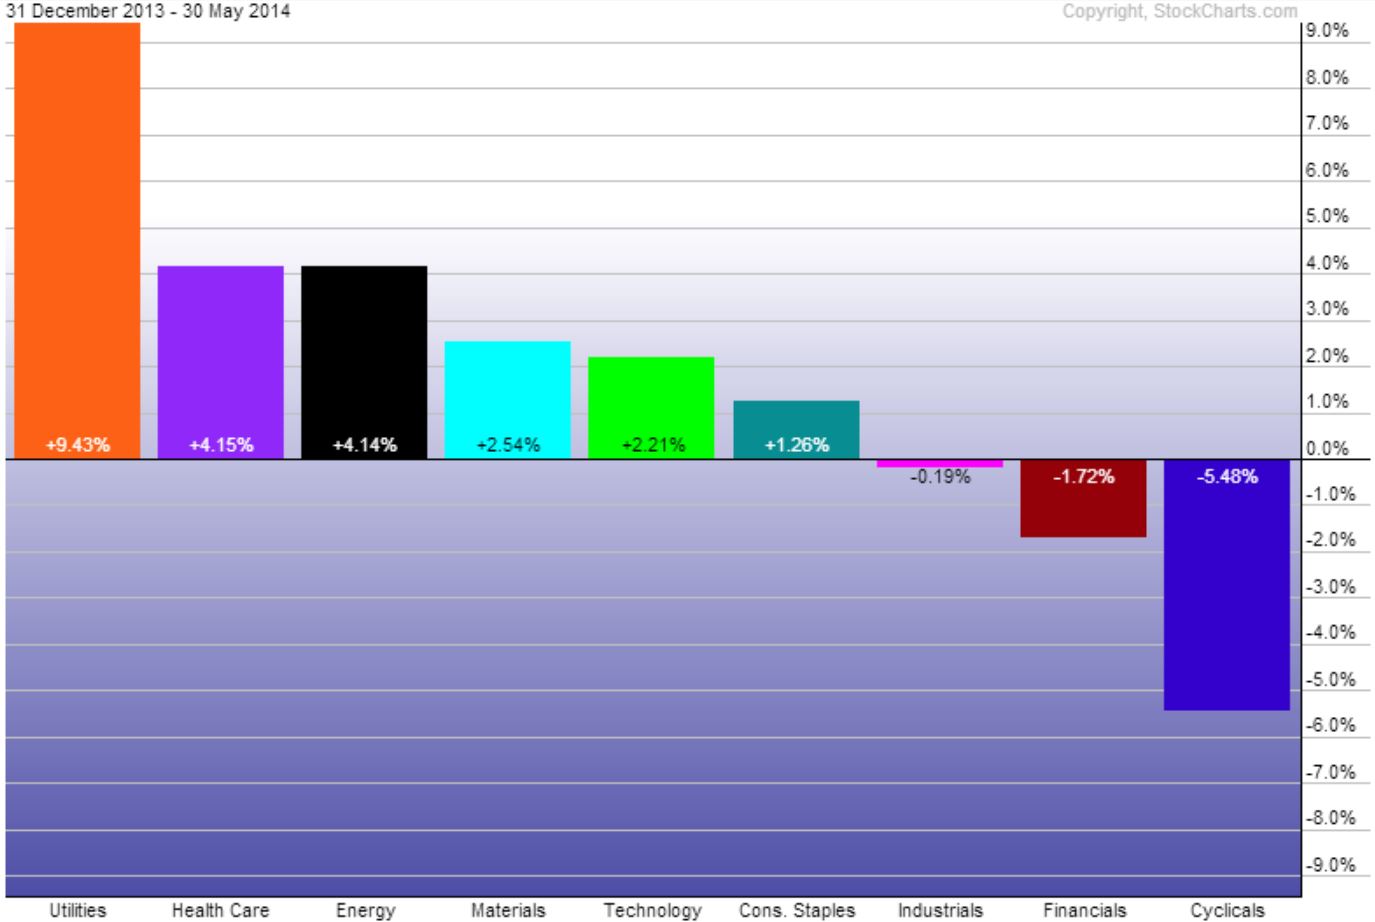
With last week’s strength, Utilities continue to be the strongest sector YTD with Healthcare and Energy (SPDR Energy Select Sector Fund (ARCA:XLE)) are nearly tied for second place. Consumer Discretionary (SPDR Consumer Discr. Select Sector (ARCA:XLY)), Financial (Financial Select Sector SPDR Fund (ARCA:XLF)), and Industrials (Industrial Sector SPDR Trust (ARCA:XLI)) are the only sectors still unable to keep up with the S&P 500 so far this year.
Disclaimer: Do not construe anything written in this post or this blog in its entirety as a recommendation, research, or an offer to buy or sell any securities. Everything in this post is meant for educational and entertainment purposes only. I or my affiliates may hold positions in securities mentioned in the blog. Please see my Disclosure page for full disclaimer.

