This has been an interesting start to the new year. Just about every major news source has spilled ink on the ‘January effect’ and the impact of a down start of a year has on the performance for the year as a whole. In November I wrote about the predictability the time period between November and January had for the following year and that history has shown it to be a better indicator than simply monitoring January or the first five days of January. While there’s still another week left for this method, it’s currently showing a negative performance which is not positive for 2015. But this week’s price action could reverse that and it’s something I’ll be keeping an eye on.
Trend
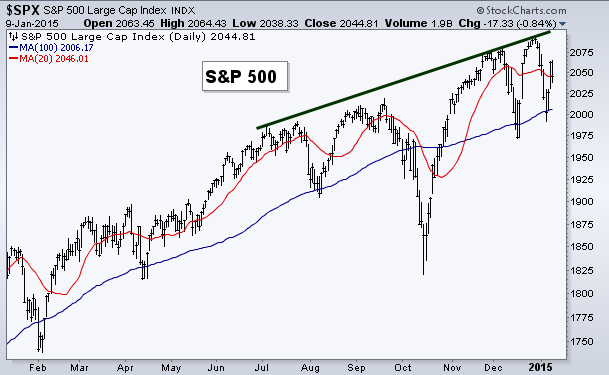
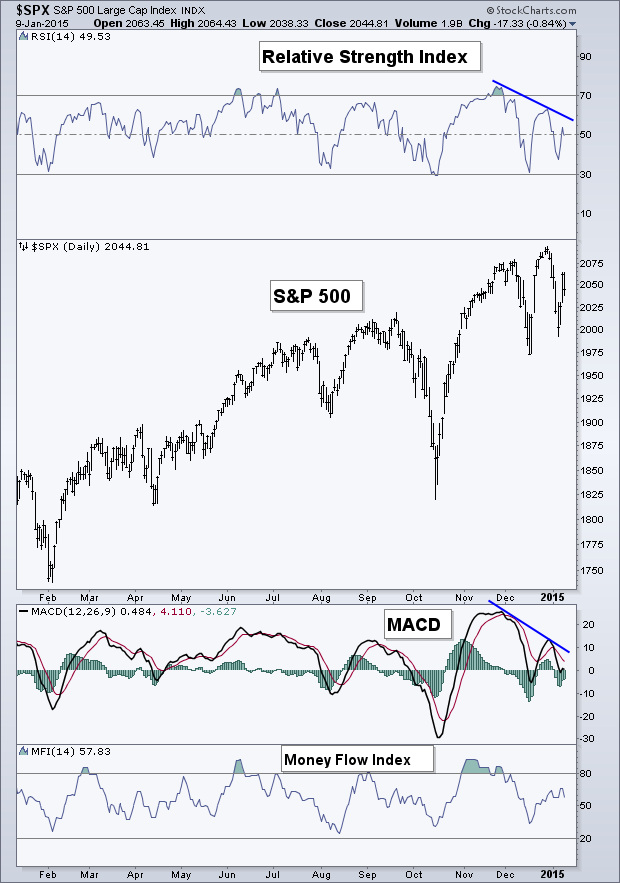
The trend of the S&P 500 (SPX) remains positive as the recent short drop was ended with a higher low in price. the 100-day Moving Average acted as a low point. We’ll see if price is able to take out the prior January high and keep the up trend intact.
Breadth
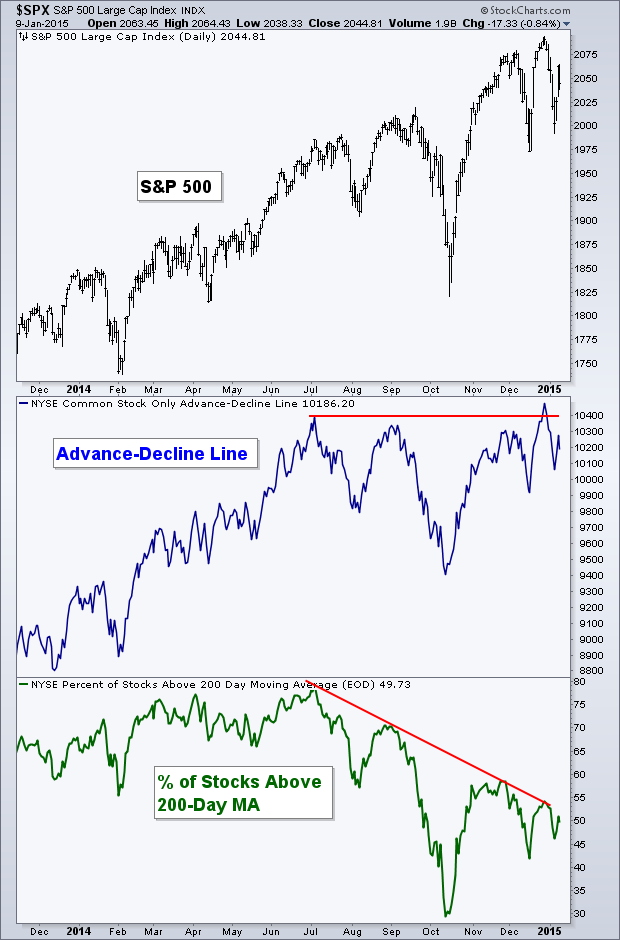
While at the prior January high we saw the Common Stock-Only, Advance-Decline Line break above its prior high, it has now gone back under the peak. However, like price it made a higher low on the recent drop. The Percentage of Stocks Above Their 200-day Moving Average remains in a clear down trend.
Hedge Funds Become More Gloomy
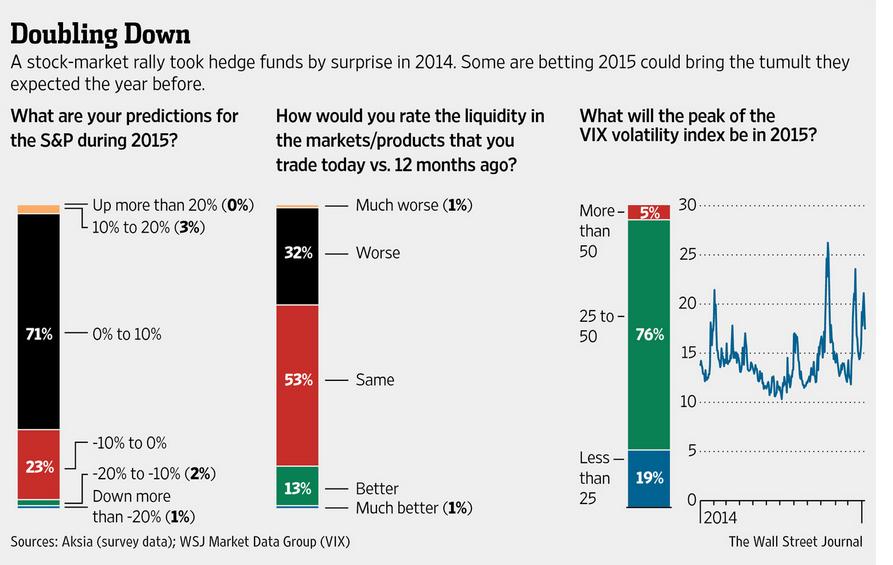
While hedge funds have struggled to shine like the bright star they believe themselves to be, according to a survey of 200 funds by Aksia as reported by the WSJ, they don’t have high hopes for equities in 2015. Over 70% of those surveyed do not expect returns to exceed 10%, potentially ending the streak of double-digit gains for the S&P 500.
Yield Curve
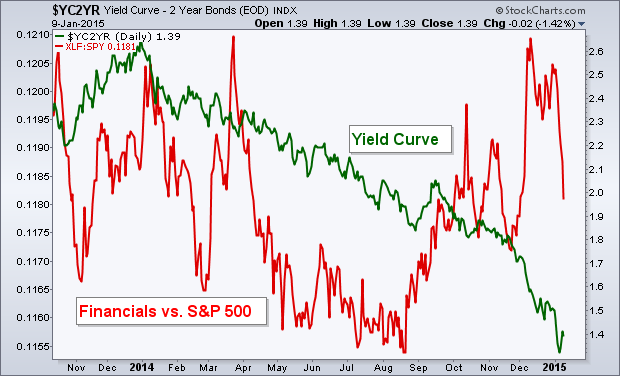
As the yield curve has continued to seek out lower lows in 2015, following the pattern of 2014 this could have implications for the financial sector (Financial Select Sector SPDR Fund (ARCA:XLF)). We typically see the financial sector outpace the S&P 500 in a rising yield curve environment. The sector broke this trend after the relative performance bottomed in November and began to outperform the major index while the yield curve headed lower. However, this breakaway has sense reversed recently with XLF taking some punches over the last week while the S&P rallied.
Momentum
In the last Technical Market Outlook I wrote I noticed the negative divergence that had been taking place between the S&P and momentum. Price began to drift lower after that point and while the equity index has yet to regain its prior high, neither has momentum.
Gold
While the focus has been on oil over the last several months, gold has been consolidating on the weekly chart. After temporarily breaking below the 2013 lows, gold has risen back above and trying to hold above $1,200. Momentum, specifically the Relative Price Index (RSI) and MACD indicators, have created positive divergences with the test of the prior lows. I’m watching to see if gold can get back above $1,250 and momentum continue to gain ground as buyers step back in.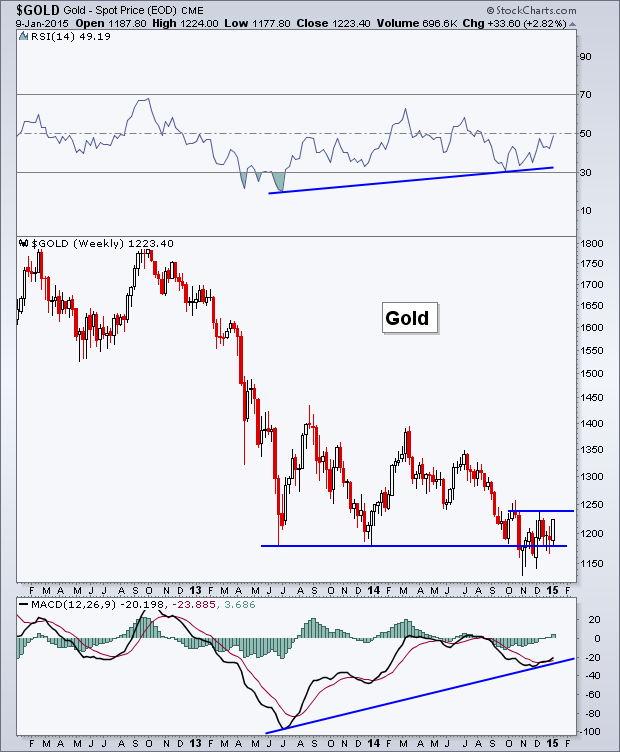
Corn
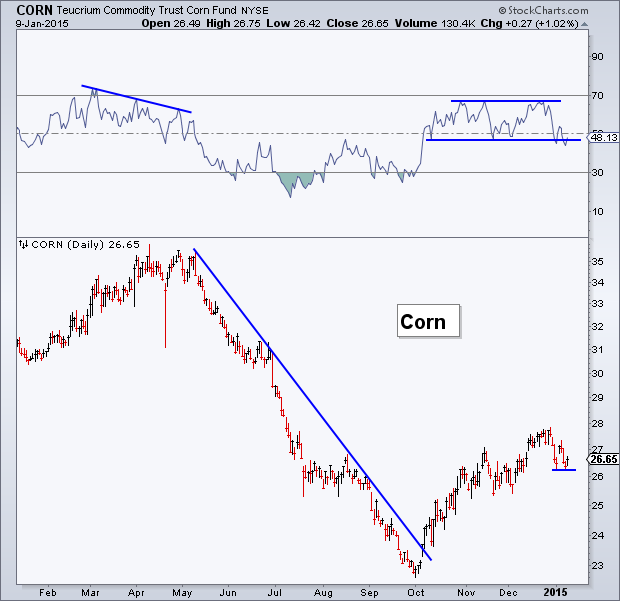
I last wrote about corn in October, “Are Corn Prices Poised To Rise?” showing the break of the declining trend line, the commodity entering a bullish period of seasonality, and the low-level of sentiment. Since then we’ve seen corn prices continue to rise, with the CORN ETF (Teucrium Corn (NYSE:CORN)) testing $28. The Relative Strength Index (RSI) is now in a channel as price begins to weaken. I’m watching to see if momentum can break above or below its channel lines and if price can hold above its short-term low just above $26.
Year-to-Date Sector Performance
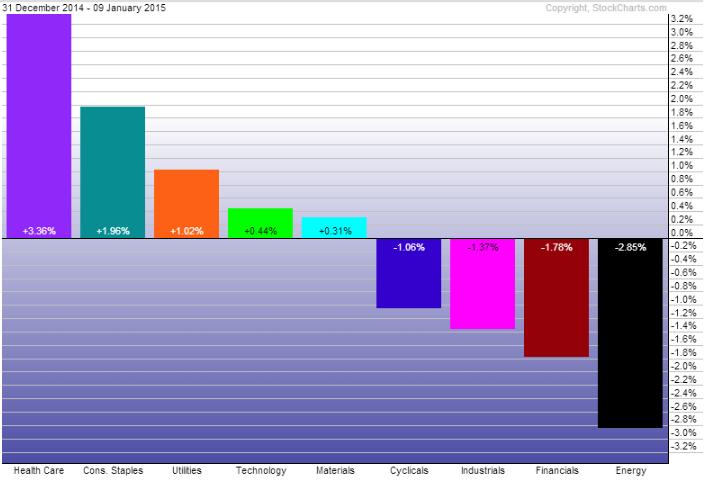
As 2015 gets started the relative performance of the nine S&P sectors already looks like a repeat of ’14. Health Care (SPDR - Health Care (ARCA:XLV)). Consumer Staples (SPDR - Consumer Staples (ARCA:XLP)), and Utilities (SPDR Select Sector - Utilities (NYSE:XLU)) have led for the first eight days of the year. While Energy (SPDR Energy Select Sector Fund (ARCA:XLE)) and Financials (Financial Select Sector SPDR Fund (ARCA:XLF)) are the worst performers so far this year.
Disclaimer: Do not construe anything written in this post or this blog in its entirety as a recommendation, research, or an offer to buy or sell any securities. Everything in this post is meant for educational and entertainment purposes only. I or my affiliates may hold positions in securities mentioned in the blog. Please see my Disclosure page for full disclaimer.
