In this week's market analysis, we will look at potential trading opportunities and zones where we should look for evidence and potential moves.
Pairs and markets analyzed this week: AUD/USD, CAD/CHF, EUR/AUD, EUR/USD, USD/CHF, USD/JPY and S&P 500.
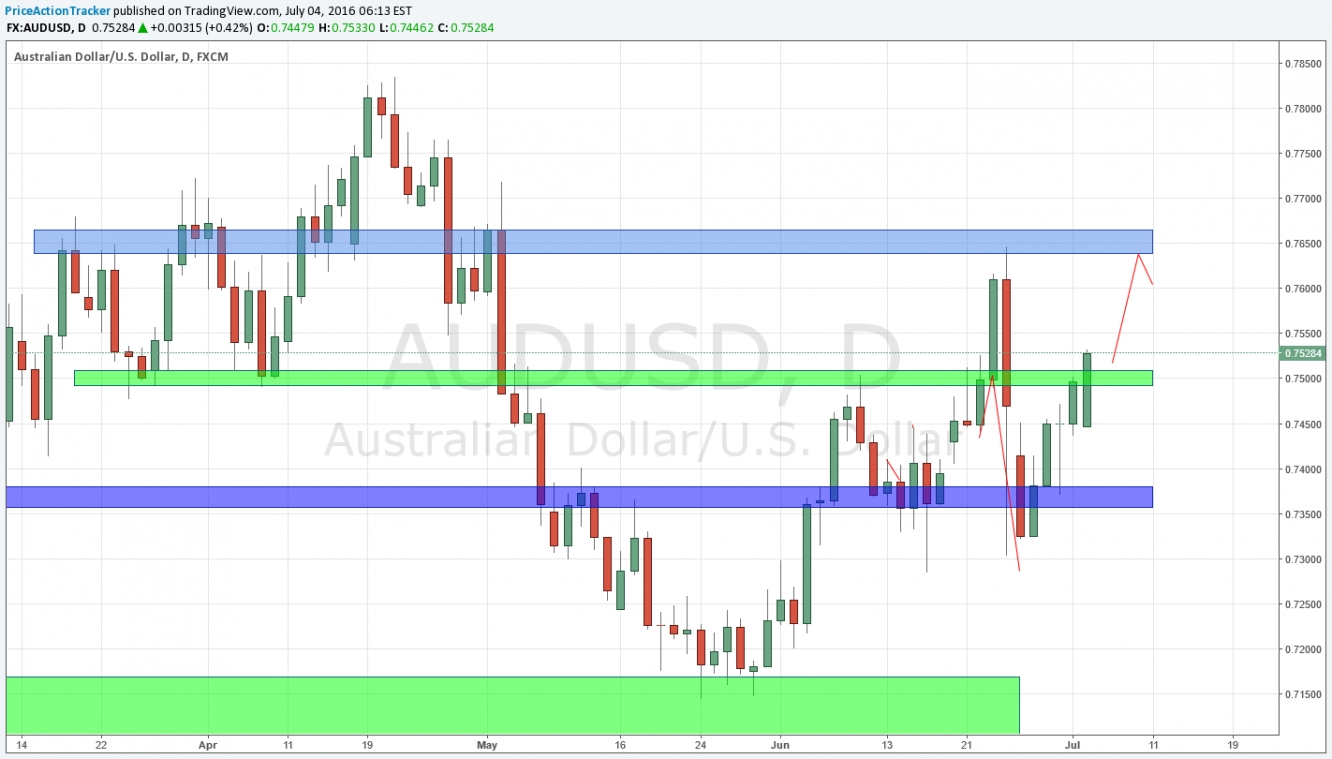
AUD/USD - Waiting for price action near resistance
AUD/USD price is approaching strong zone 0.763-0.766. Watch out for bearish evidence and a potential move to the downside from this major zone.
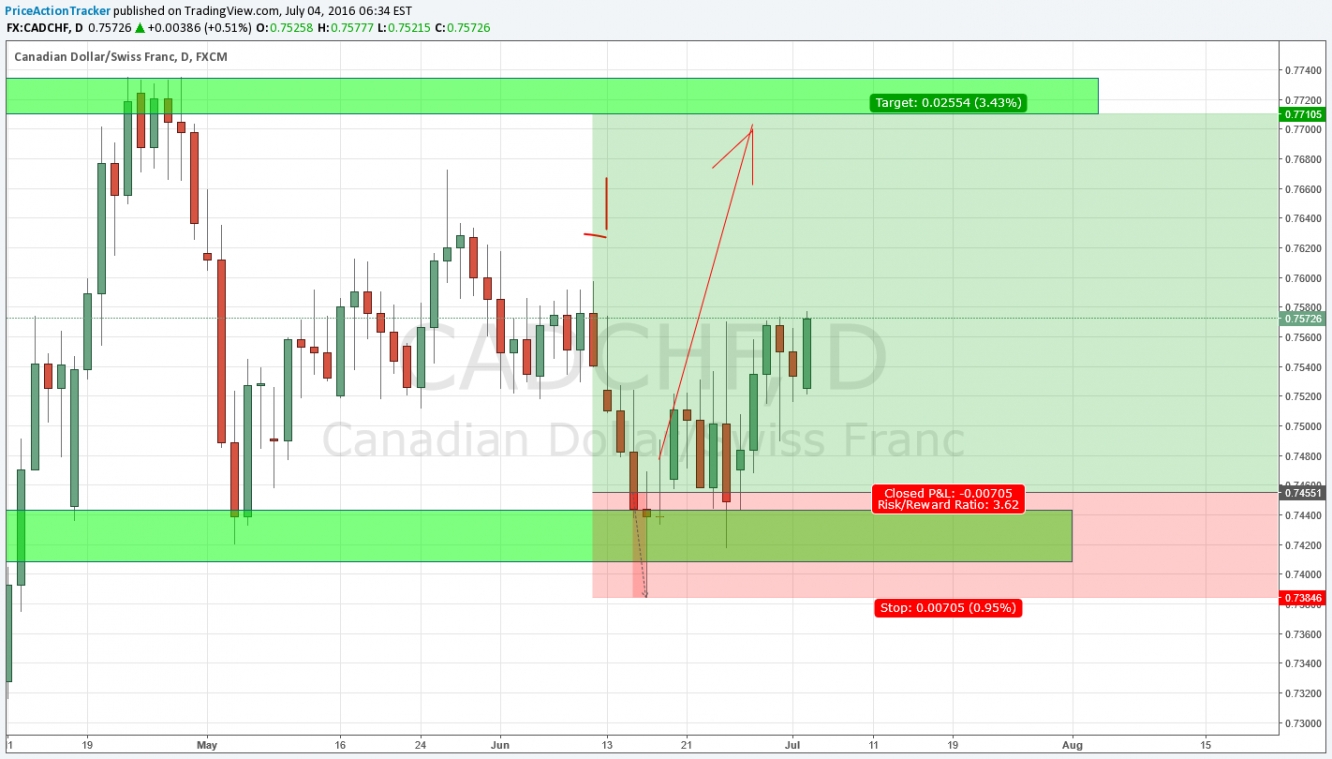
CAD/CHF - Still going long, waiting for price action to exit trade
We entered this trade 3 weeks ago. We were waiting for bullish evidence (price action) near the highlighted support to go long, and this is what we did when we saw this pinbar on June 16th. For those who went long and aimed for a 3.6:1 return, be patient but watch out for bearish evidence to exit this trade (you should now be very close to 2:1).
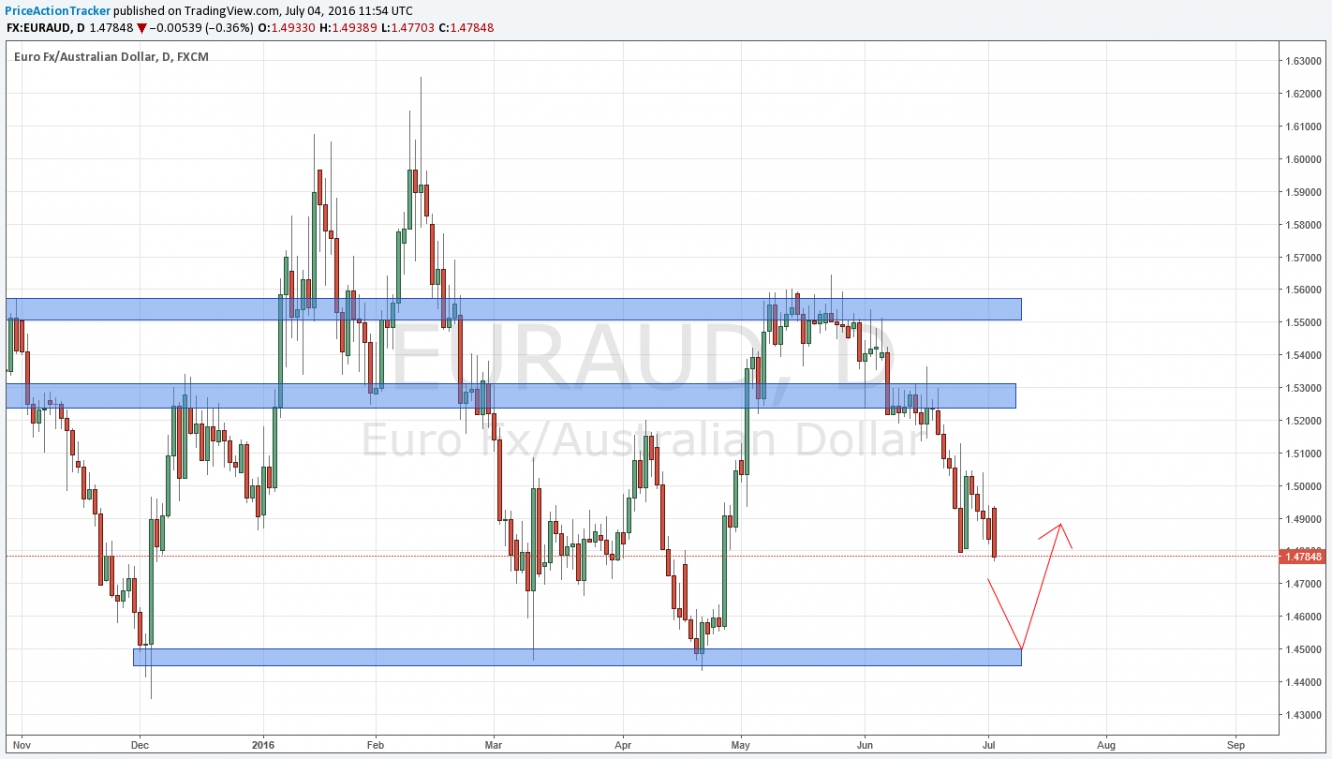
EUR/AUD - Waiting for price action near support
EUR/AUD price is approaching strong zone 1.444-1.45. Watch out for bullish evidence and a potential move to the upside from this major zone.
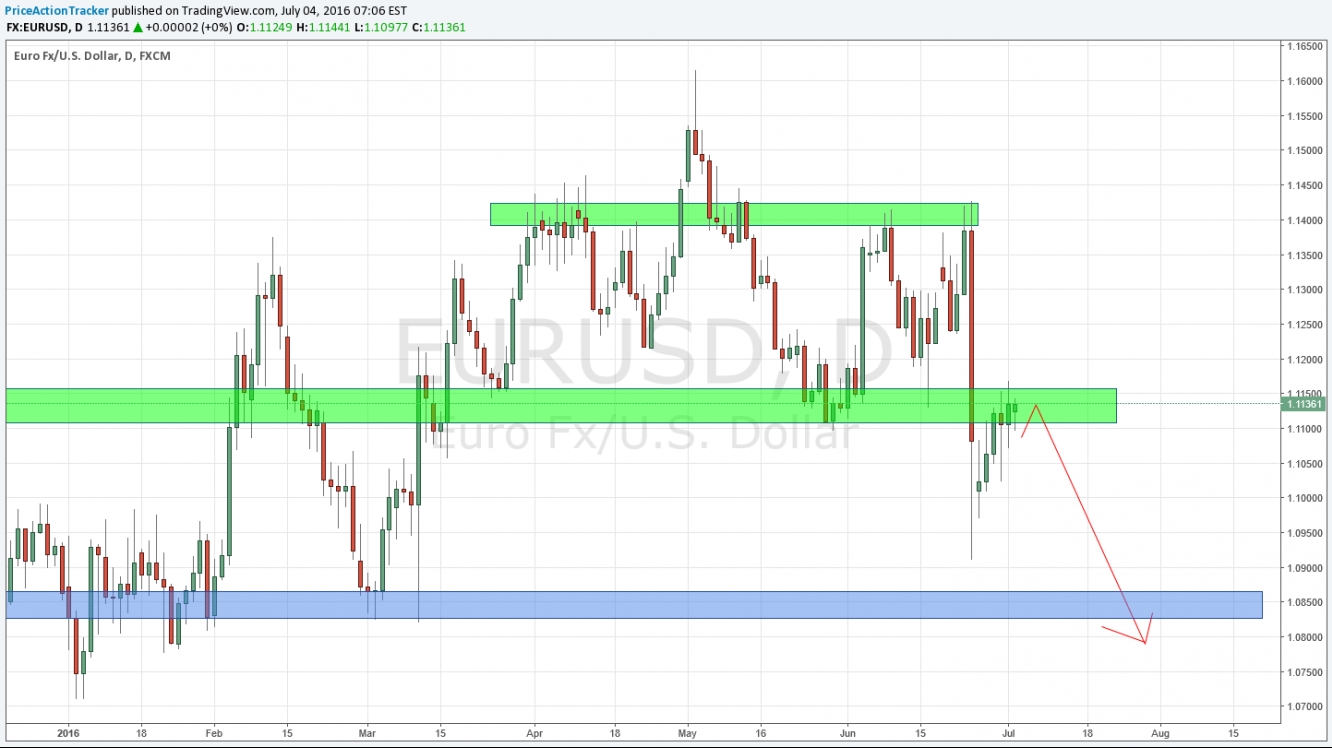
EUR/USD - Potential pullback, watch out for price action
EUR/USD could have a potential pullback. Watch out for price action. EUR/USD is testing resistance zone 1.110-1.116.
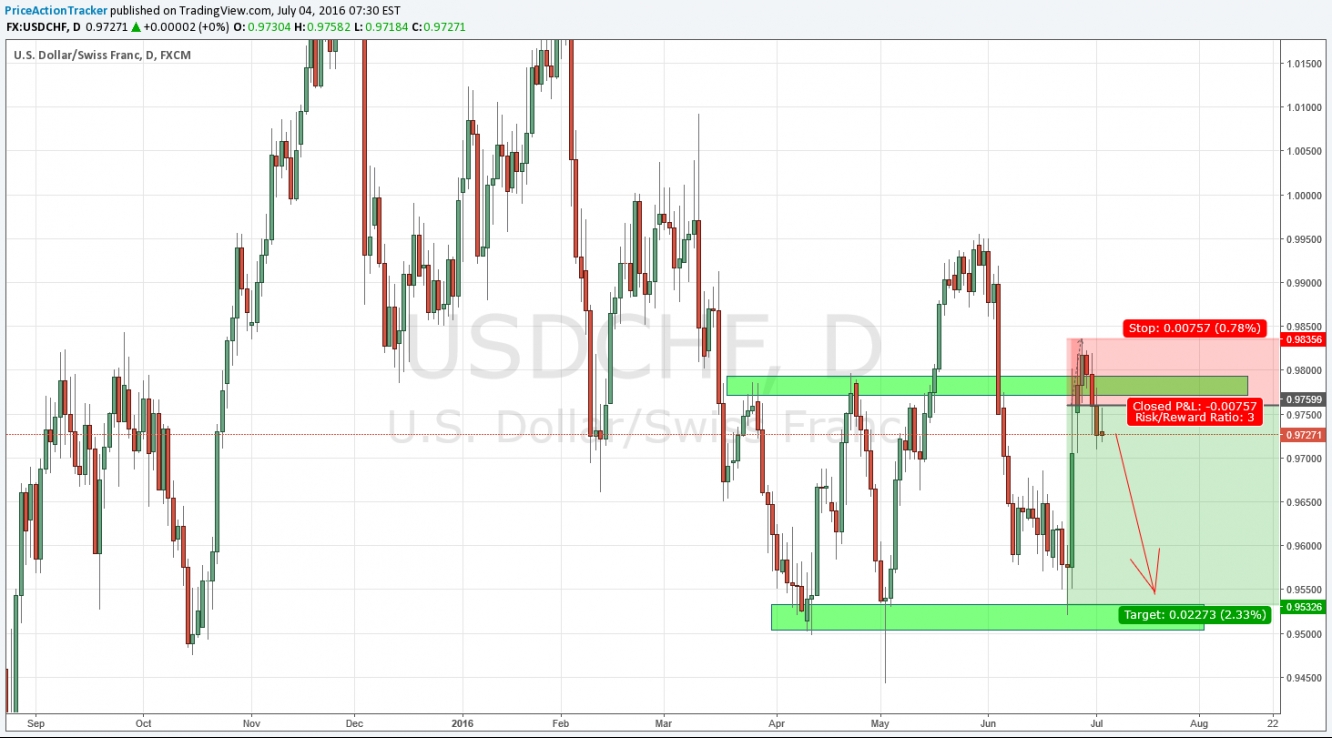
USD/CHF - Going short after bearish price action, aiming for 3:1 return
USD/CHF was testing the 0.977-0.9979 resistance zone. We went short with the bearish engulfing reversal price action, and we're aiming for a 3:1 return.
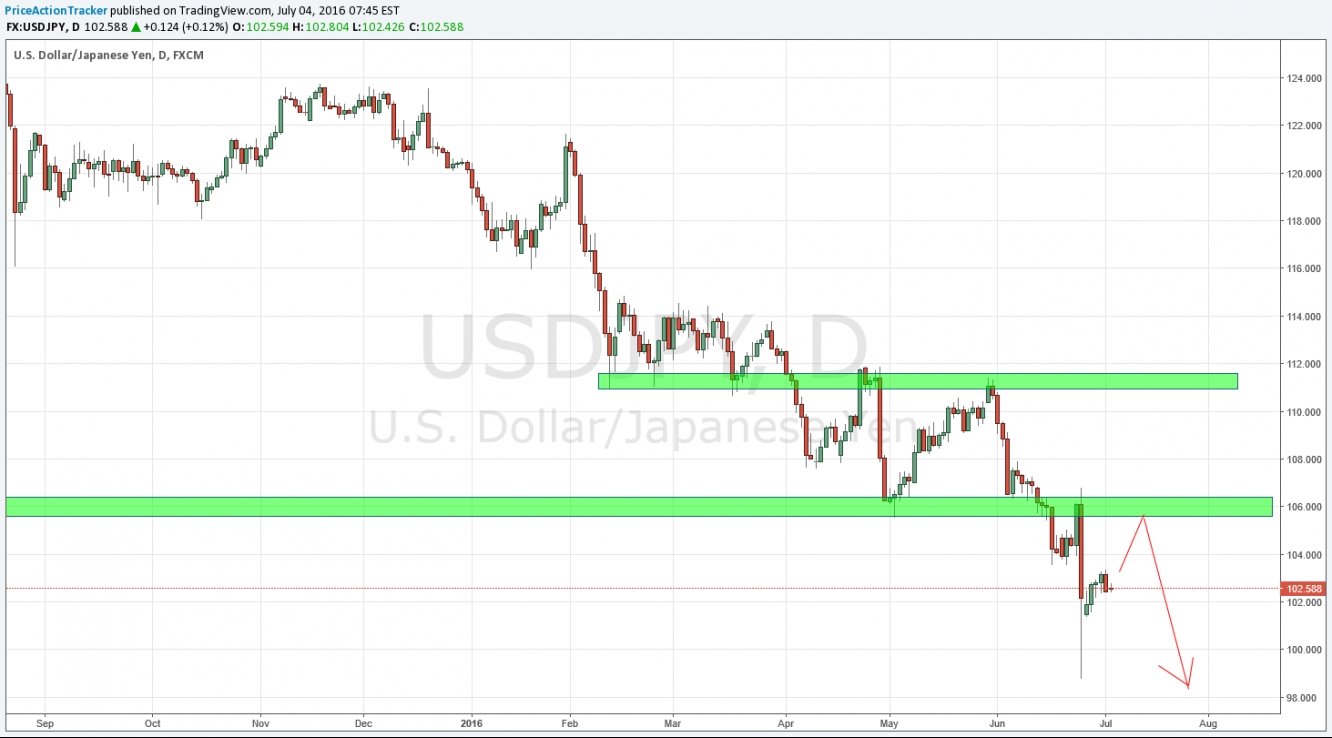
USD/JPY - Potential pullback, watch out for price action
USD/JPY is still in a downtrend. Keep an eye on this pair if it goes up to test the 105.56-106.44 resistance zone - this could be a great pullback opportunity. Watch out for bearish evidence and a potential move to the downside from this major zone.
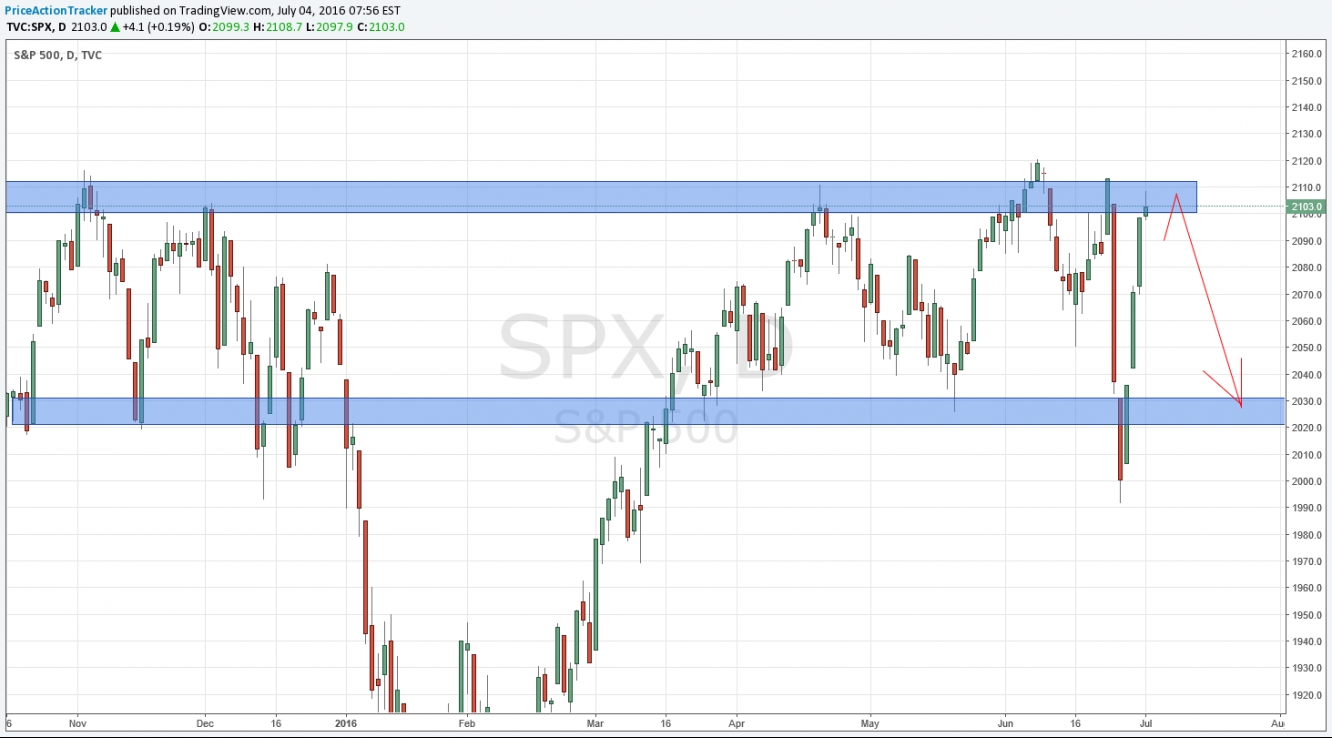
SPX - Testing resistance, watch out for bearish price action
SPX is testing strong resistance zone 2100-2112. Watch out for bearish evidence and a potential move to the downside from this major zone.
Disclaimer: This is educational and general information only (not advice or a recommendation).
Trading financial instruments, including Stocks, Futures, Forex or Options on margin, carries a high level of risk and is not suitable for all investors. The high degree of leverage can work against you as well as for you. Before deciding to invest in financial instruments or foreign exchange you should carefully consider your investment objectives, level of experience, and risk appetite. The possibility exists that your losses can exceed deposits and therefore you should not invest money you cannot afford to lose. You should be aware of all the risks associated with trading and seek advice from an independent financial advisor if you have any doubts. Past performance, whether actual or hypothetical, is not necessarily indicative of future results. All depictions of trades whether by video or image are for illustrative purposes only and not a recommendation to buy or sell any particular financial instrument. See full risk disclosure. By viewing this site's Content or Videos you agree to the Privacy and Disclaimer.

