Weekly chart wrap for the week ending 6/5/2015 – we saw some seismic moves in interest rates as equities began to show some chinks in their armor. The current trends are as follows:
- Oil: Oscillating within a range
- Precious metals: Lower
- Bond yields: Higher
- Equities: Oscillating within a range
WTI Crude Oil (Daily)
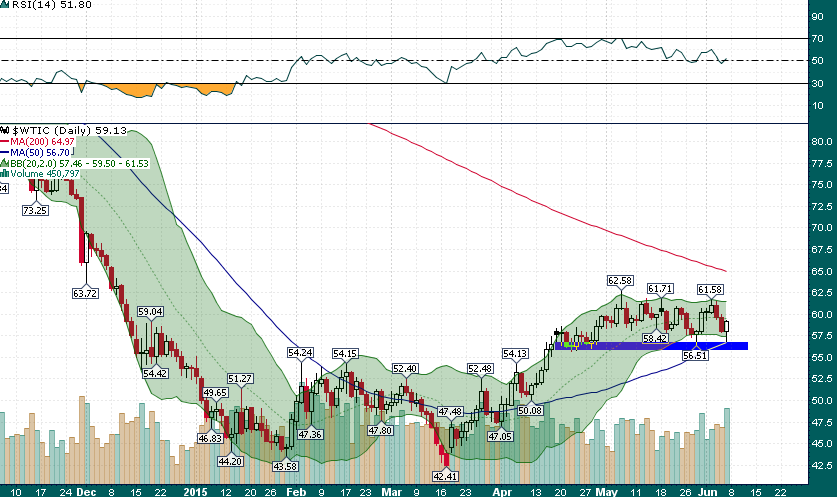
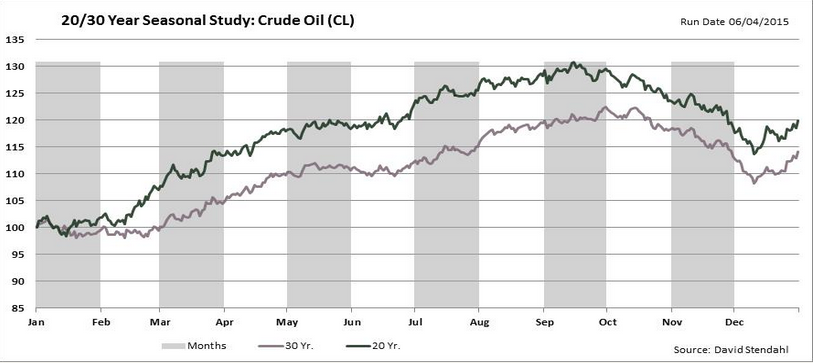
Crude found support near the rising 50-day simple moving average, and ended the week with an impressive reversal on heavy volume. If crude can hold up for the next couple of weeks, bullish seasonality will offer a tailwind for the rest of the summer:
Gold Futures Commitments of Traders Data
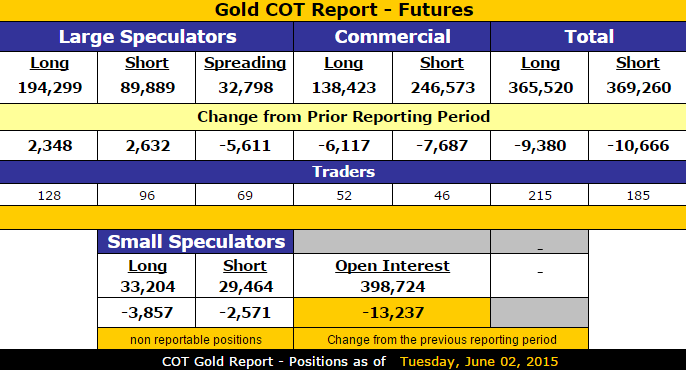
The main takeaways from this report are the drop-off in small speculators open interest and the relatively unchanged positioning of large speculators. It seems that once again, the specs were aggressively positioned to the wrong side just in time for the $30+ decline to end the week.
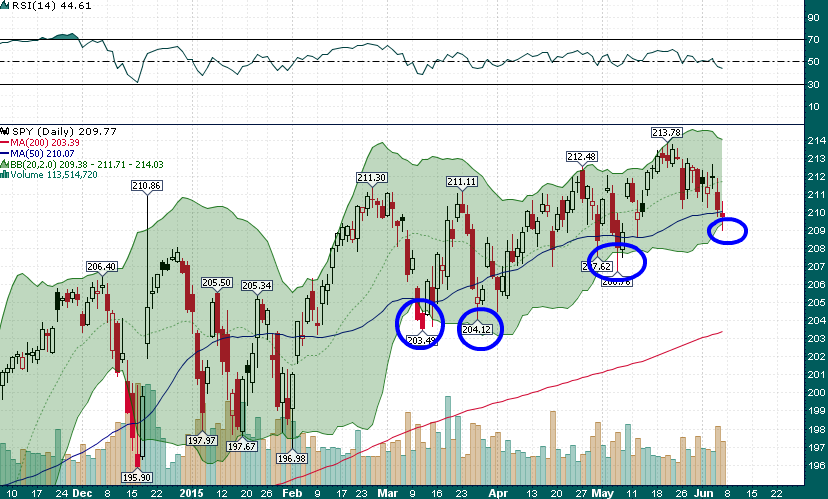
Yet another test of the lower Bollinger Band for the S&P – another buying opportunity?
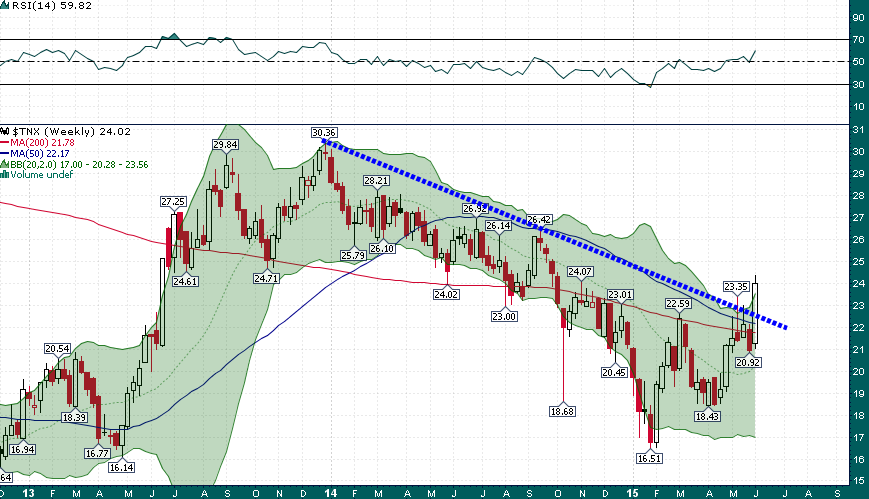
An emphatic breakout from a 17-month downtrend in 10-year Treasury yields. The weekly close at the 2.40% yield level is quite significant given the importance of this level during the past couple of years. I believe it would be foolish to ignore the multiple technical patterns, which resolved higher in yields last week.