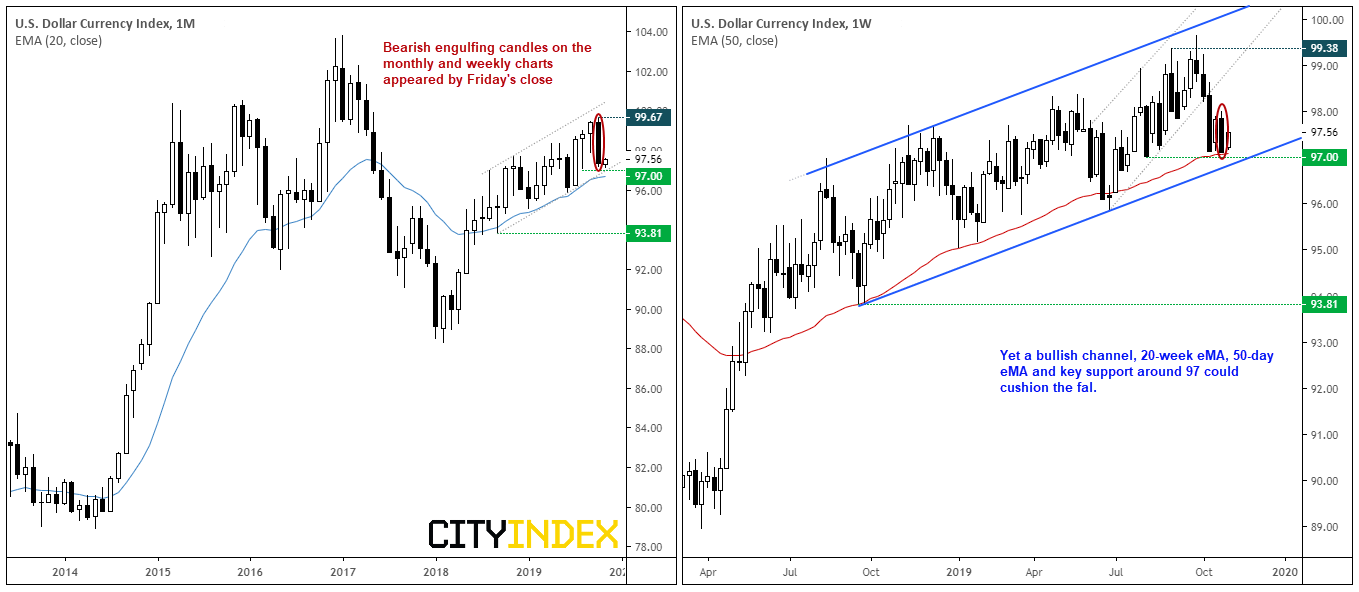
The U.S. Dollar Index (DXY) presented traders with a bearish engulfing candle on both the weekly and monthly chart by Friday’s close. So, will this bearish pattern live up to its grizzly name in the weeks ahead?

As of Friday, it was DXY’s most bearish close since January 2018. Yet key support around 97, previously highlighted, has continued to hold and bulls managed a minor rally from this level yesterday. We doubt it will be easy for bears to break 97 easily and, even if they do, there’s also the 20-week eMA and lower trendline to content with.
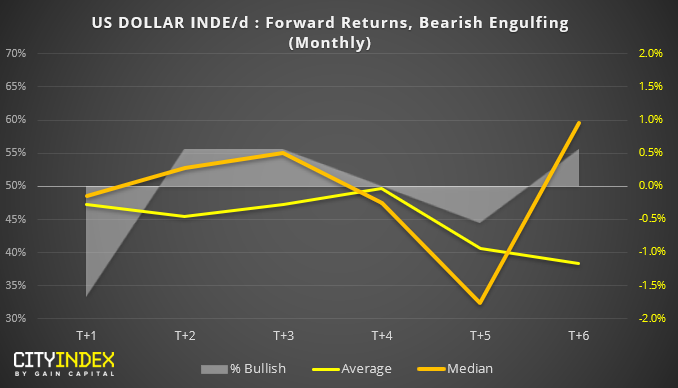
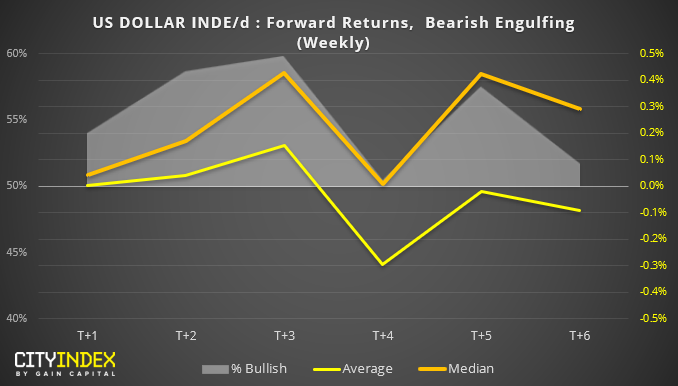
But, for today we’ll see just how bearish a bearish engulfing candle is. Using Reuters data from 1986, here’s how bearish engulfing candles have played out in the following months and weeks.


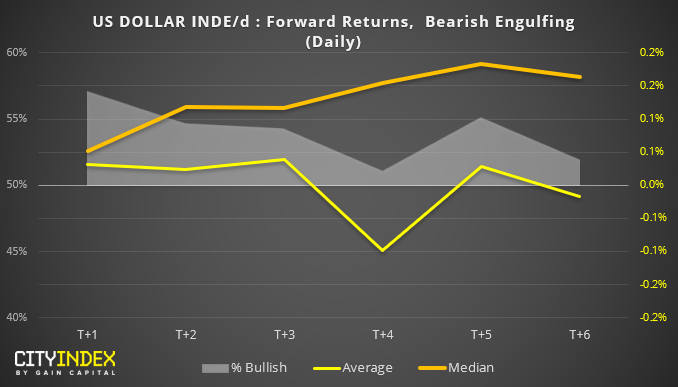
Whilst we’re here, we may as well include the results for the daily chart too. Yet the results appear similar to the weekly data; bearish engulfing candles on the daily are typically bullish over 50% of the time between T+1 to T+6.
From the data above, it doesn’t appear that bearish engulfing candles on DXY have been favourable to bears on the weekly and daily charts. Given the key level of support nearby and the fact that most of my Twitter feed is now bearish on the USD, the contrarian within me wonders if there may be further upside on the dollar over the coming week/s.
