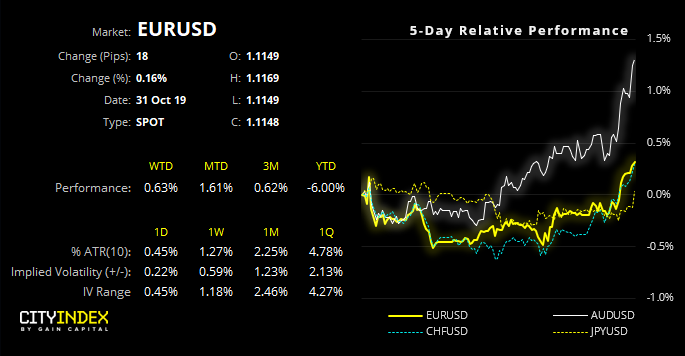
With DXY and several FX majors approaching their latest set of key levels, we could find they’ll decide whether to break or reverse these levels in unison. Whilst the Fed’s statement teased traders with a hawkish cut, the press conference pulled the rug from under bullish bets after Powell stated it would take a “significant” rise in inflation before it would consider a hike. The dollars bearish reaction shows some literally ‘bought’ the ‘mid-cycle adjustment’ phrase and still considered hikes to be on the horizon. Personally, I believe the Fed are likely to cut rates further, just not at the pace Trump would like (as they’d likely be at 0% if he had his way).

Regardless, the current price on USD is challenging the tendency for USD to rise 3-10 days after a Fed cut rates. That said, we are approaching key levels on the USD ahead of tomorrow’s NFP, which means the USD is fast approaching a technical juncture for bulls and bears to scrap it out. And with all FX majors aligned against the USD, it could take all pairs to break key levels for us to expect a sustainable, downside move on the USD. Conversely, if they fail in unison, it leaves bulls the potential to buy USD at a discount.
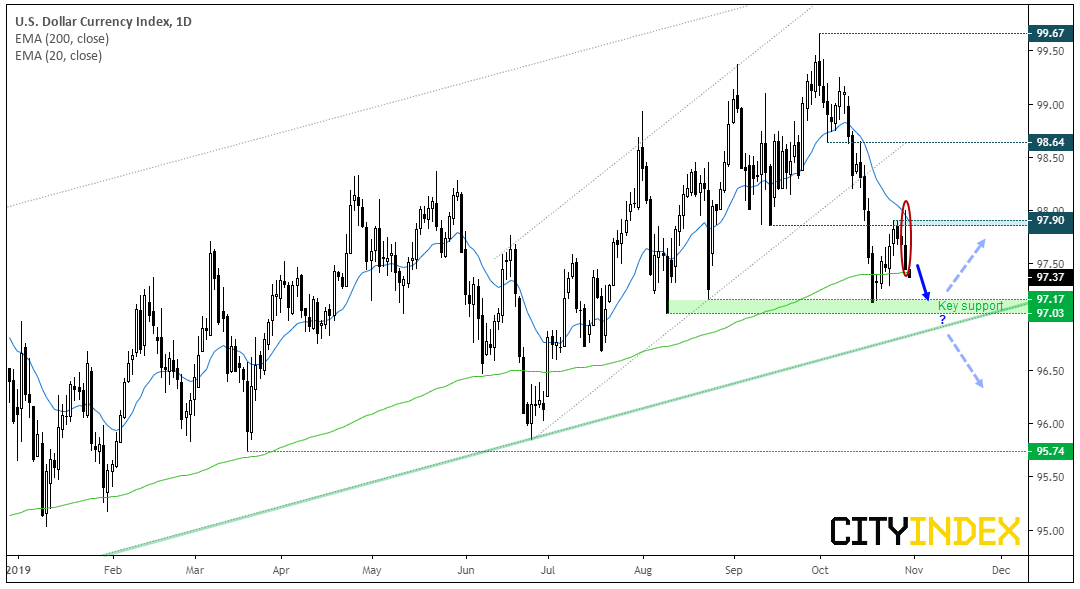
A bearish key reversal day has formed on DXY which warns of further downside. Whilst the bias going into the meeting was for a retracement prior to breaking to a new cycle high, this development leaves room for a deeper retracement or even a move to the lower channel. Also notice that this is the first time this year that a ‘fakeout’ below the 200-day moving average has now seen prices move back towards the 200-day average, after not rallying back from above it. And given the impulsive nature of the decline from the 99.67 high, it appears we could indeed be in for at least one more break lower.


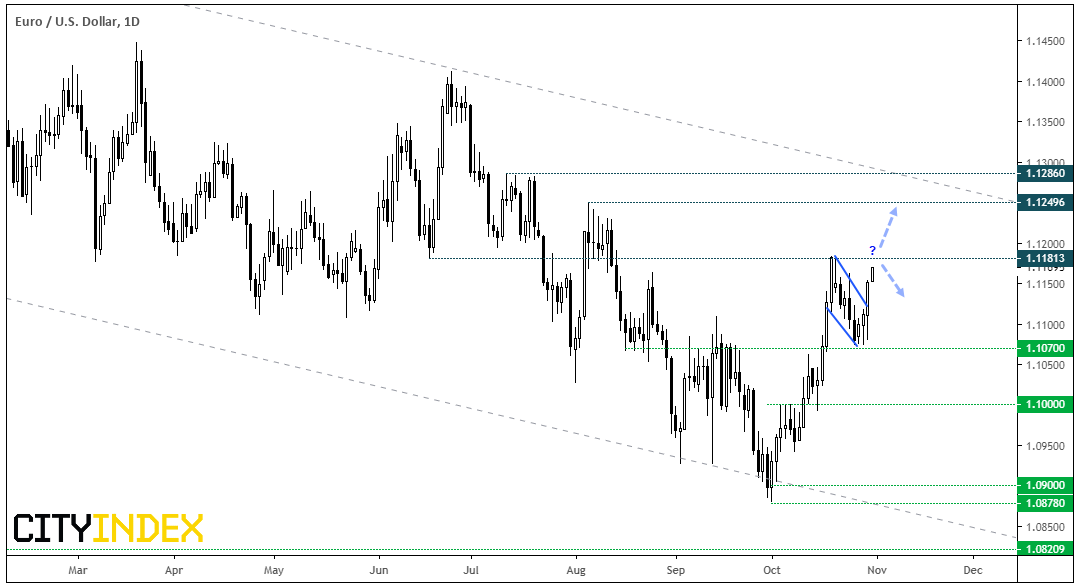
EUR/USD is closing in on key resistance. The structure is firmly bullish having broken out of a bull flag pattern, although we’d expect a bout of profit taking as we approach such a key level. If prices hover just off the highs then it’s a signal that we could be nearing a breakout. Whereas a more volatile reaction could suggest bulls are lacking in confidence. However, if it can break the 1.1181 – 1.1200 area, then bets are on for a retest of the upper bounds of the bearish channel.
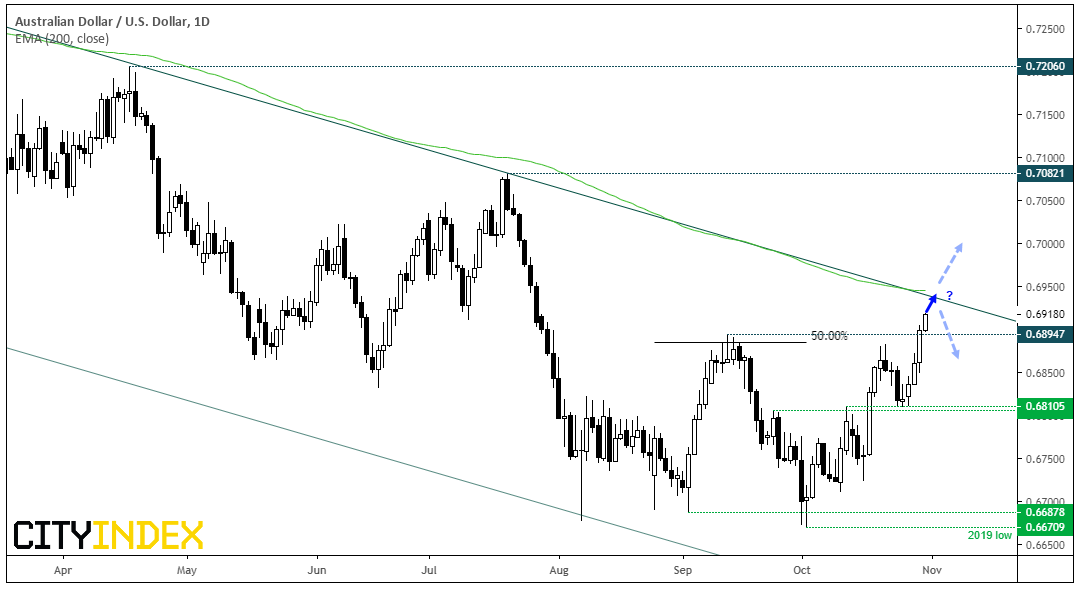
AUD/USD appears poised to re-test its 200-day eMA and upper bounds of its bearish channel. Not that RBA will like that of course, but the broadly weaker dollar is allowing further upside. The reward/risk potential is likely inadequate for traders on the daily chart, though intraday traders could seek intraday continuation patterns such as flags, pennants and triangles etc to trade with bullish momentum.
