- SPX Monitoring purposes; Sold SPX on 11/17/17 at 2578.85 = gain of .55%; long 11/15/17 at 2564.62
- Monitoring purposes Gold: Short GDX on 11/13/17 at 22.56
- Long Term Trend monitor purposes: Neutral.
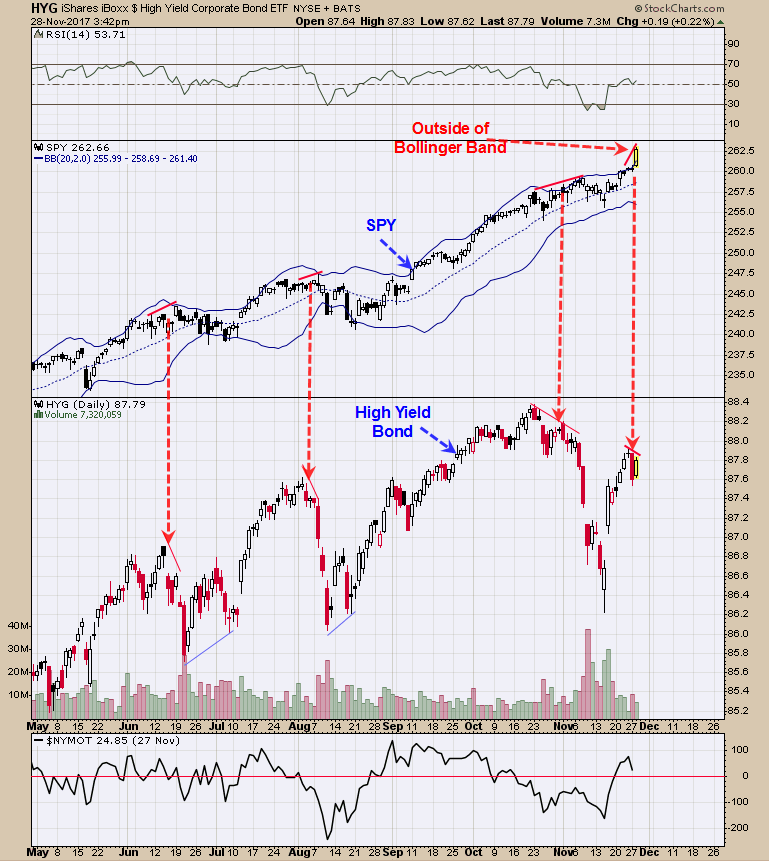
The second window down form the top is the SPY and below that is the High Yield Corporate Bond (NYSE:HYG). HYG has a good short term history of producing a divergence near short term highs on the SPY. Today the SPY surged to a new high and HYG made a lower high setting up a short term divergence along with the SPY closing outside of its upper Bollinger® band and add to the divergences. When the SPY closed this far above its upper Bollinger Band (tested back to 2013) the market at least pulled back to its mid Bollinger Band. There is a likelihood that a better entry ahead than today’s close. There could be backing and filling short term, but the trend is up into year end. Follow us are twitter. @OrdOracle. Ask for fee 30 day trial.
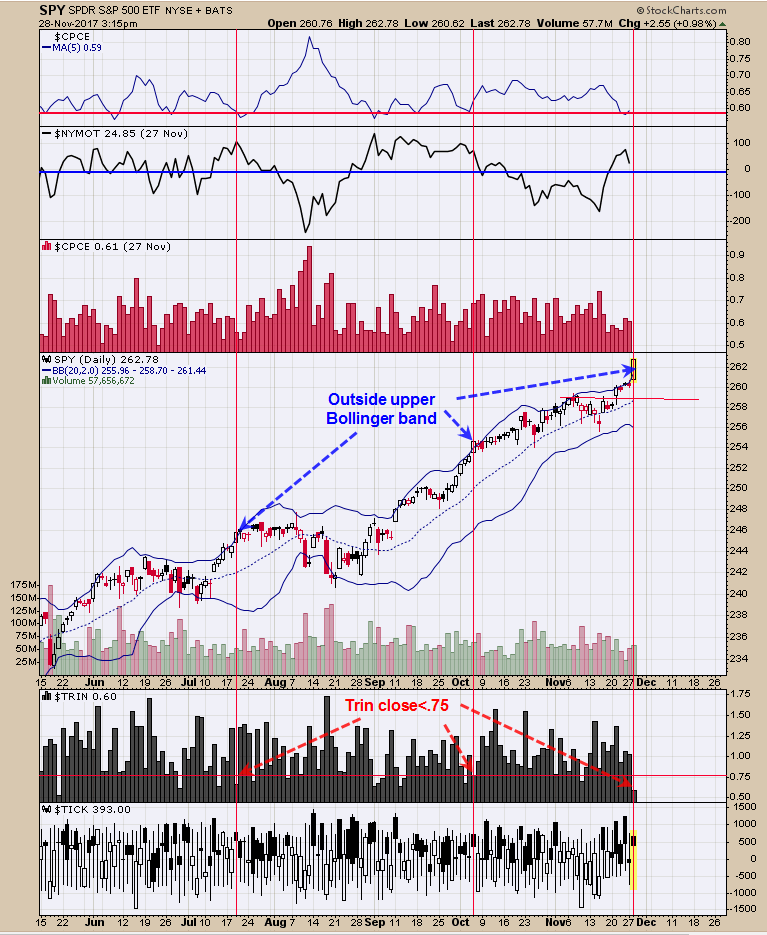
The trend remains bullish. The week after Black Friday is usually a quite week and so far that is not the case. We plan to get long this week before Friday. We put a Bollinger Band on the SPX and previous times when the SPX closed above the upper Bollinger Band the market has stalled. The second window up from the bottom is the TRIN close and reading below .75 and with the SPX above the upper Bollinger band has not been a good time to buy. December is one of the best performing months of the year. This December has statistics suggesting it will be up at least 1.7% to as much as 4%. The Thursday after Black Friday is the worst performance day of this week and could be a target day. Friday of this week is up 82% of the time with an average gain of .63%. Sold SPX on 11/17/17 at 2578.85 = gain of .55%; long 11/15/17 at 2564.62. Follow us are twitter. @OrdOracle.
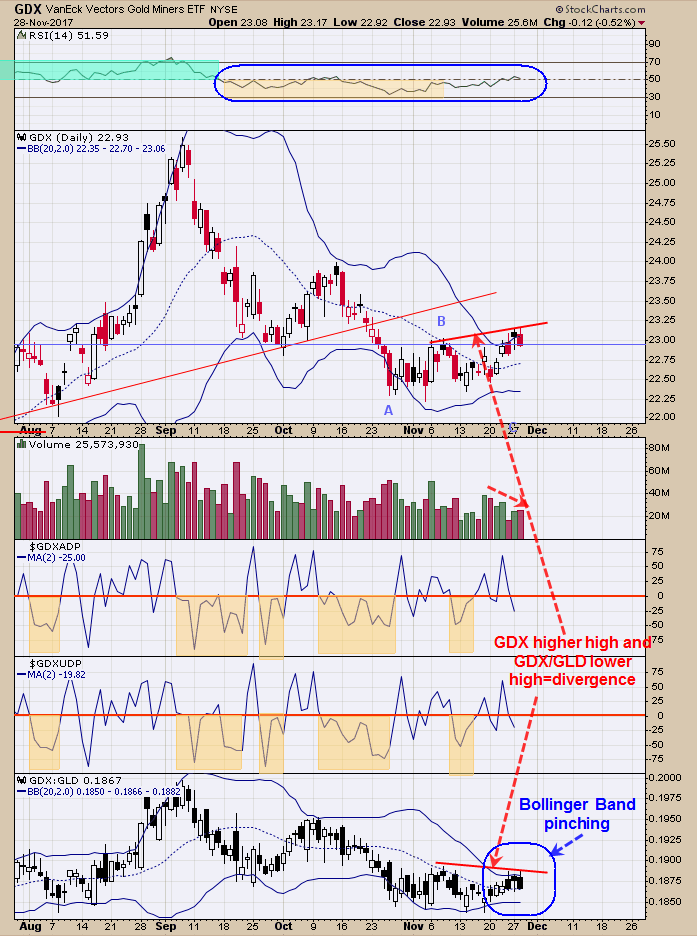
The COT Commercials bumped their short position to 225K up from 215K last week and remain bearish. GDX is still outperforming GDX/GLD ratio where GDX made a short term higher high and GDX/GLD ratio did not and the divergence remains. The bottom window is the GDX/GLD ratio which its Bollinger Bands are pinching suggesting this ratio is about to expand. With the Bullish Percent index for the Gold miners setting at 29% (29% of the gold stocks in Gold miners index on buy signal), the Pinching of the Bollinger Band on the GDX/GLD ratio suggests the break may be to the downside. The back and forth in GDX could last into next week. A major Cycle low is due in late December and market usually head down into cycle lows. Short GDX on 11/13/17 at 22.56. Visit www.ord-oracle.com. New Book release "The Secret Science of Price and Volume" by Timothy Ord.


