- Monitoring purposes SPX; Sold 9/30/14 at 1972.29= gain .003%; Long SPX on 9/25/14 at 1965.99.
- Monitoring purposes Gold: Gold ETF GLD long at 173.59 on 9/21/11.
- Long-Term Trend monitor purposes: Flat

Timers Digest recorded the Ord Oracle # 10 in performance for one year time frame updated October 27.
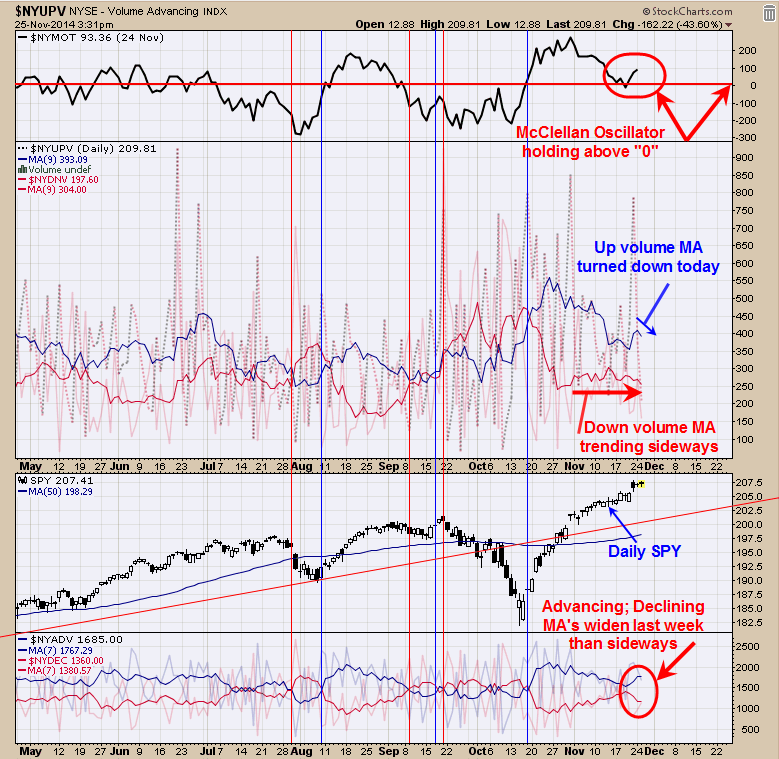
Above is a short-term picture of the internals statistics of the market. The top window is the McClellan Oscillator, which is above “0” line and a positive for the market, short term. Next window down is the 9 period moving average of the up volume (blue line) and 9 period moving average of the down volume (red line). When up volume blue line is below down volume red line, than that would produce a bearish crossover and a bearish sign for the market. Since mid October the Up volume blue line has been above the down volume red line and a bullish condition. When the Up volume blue line crosses below the down Volume red line will indicate the volume statistics have become bearish. The bottom window is the 7 period moving average of the advancing issues (blue line) and 7 period moving average of the declining issues (red line). Right now the advancing issues is on top of the declining issues and shows that there are more issues advancing than declining and bullish. When the Red line is on top than that will show there are more issues declining than advancing and a bearish sign. Our short term measures are still positive but in a weakening position.

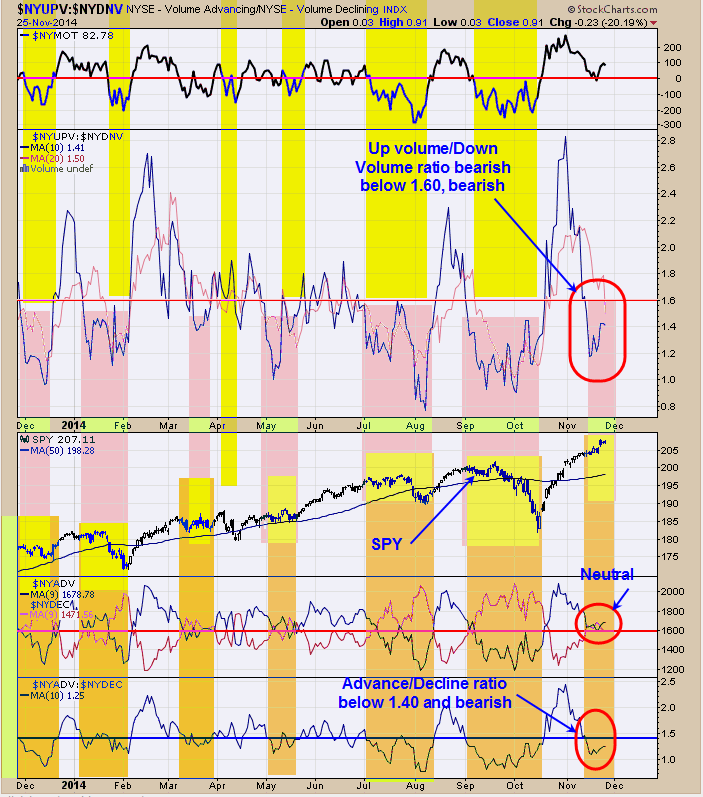
Above is similar statistics discussed on page one but presented in a different way. The bottom window is the NYSE advance issues and NYSE declining issues presented in a ratio. It has been a bearish sign for the market when this ratio falls below 1.40 (current reading is 1.25) and noted with an orange shade. The window above the SPY window is the NYSE up volume and NYSE Down volume presented in a ratio. When this ratio is below 1.60 it has been a bearish sign for the market (current reading is 1.41) and noted with a purple shade. When the purple shade overlaps the orange shade the color becomes yellow. Notice that the yellow regions are where the SPY had corrections. As you can see we are in the yellow region now. To get the market out the yellow region, the advance/Decline ratio would need to rise above 1.40 or the up volume/down volume ratio would need to rise above 1.60. For now the market is on yellow alert.

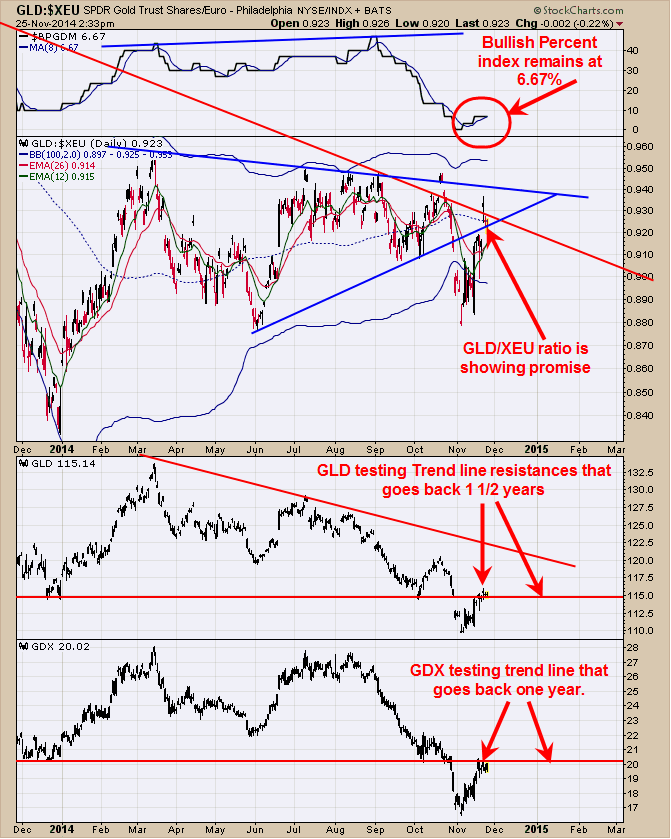
The top window is the Bullish percent index for the Gold Miners index. The Bullish Percent index still stands at 6.67% of the stock in the Gold Miners index that is on point and figure buy signals and unchanged since last week and not a healthy percentage for the market. Ideally, one would like to see the Bullish Percent index increasing as that would show the internals of the market are strengthening. Next window down is the Gld/XEU ratio. This ratio is showing bullish longer term divergence. A break above .94 with a “Sign of Strength” would turn the short term picture bullish. Next window down is (ARCA:GLD), which is running into the previous major lows and a resistance area. A break thought this resistance line with a “Sign of Strength” would change the trend to bullish and something we are watching closely. Bottom window is (ARCA:GDX), which is also running into the previous lows and a resistance area. The same thing here, if the market breaks through this resistance zone with a “Sign Of Strength” would change the picture to bullish. Gold indexes are at decision points and either market pushes through these resistances areas and turns the picture bullish or indexes back off and keep the picture neutral.
Signals are provided as general information only and are not investment recommendations. You are responsible for your own investment decisions. Past performance does not guarantee future performance. Opinions are based on historical research and data believed reliable, there is no guarantee results will be profitable. Not responsible for errors or omissions. I may invest in the vehicles mentioned . Copyright 1996-2014. To unsubscribe email to tim@ord-oracle.com.
