Investing.com’s stocks of the week
Well, just when you thought it couldn’t get worse, it did, and now the burden falls on the U.S. government to institute a severe measure of fiscal policy to restore confidence in the market. My only fear is that fiscal policy won’t come fast enough.
My only suggestion is to get on the phone, call your congressperson, and ask them to get a fiscal package together, and to do something. The market will just keep punishing all of us, until a TARP like program is instituted, in size and scope.
S&P 500 (SPY)
There has been a lot of talk about retesting the December 2018 low, well we are just about there, and for the sake of people calling for a retest, I hope they are right because the next region of support for the S&P 500 comes around 2,190, after those lows. So I guess we should be careful what we wish for. 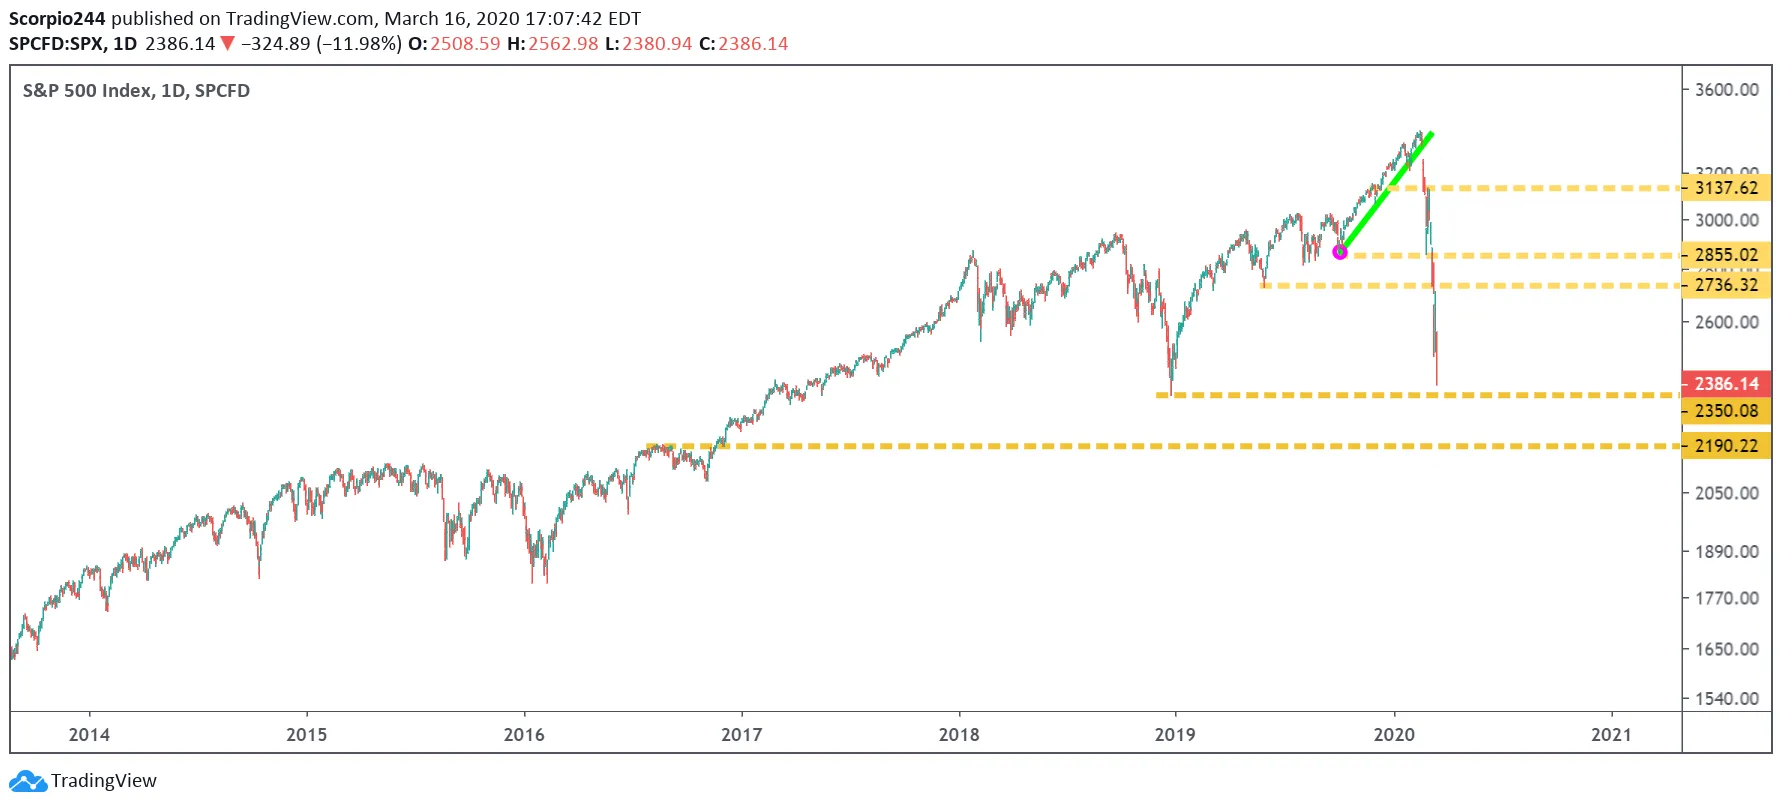
If the S&P 500 falls to 2,190, at 16 times one-year forward earnings, the S&P 500 is pricing in a decline in earnings for 2020 of 25% and a modest rebound for earnings of just 15% in 2021. It could give us earnings of around $117.85 in 2020 and $135.54 in 2021. Mind you; expectations are currently for $168.76 and $189.79, respectively.
Russell 2000 (IWM)
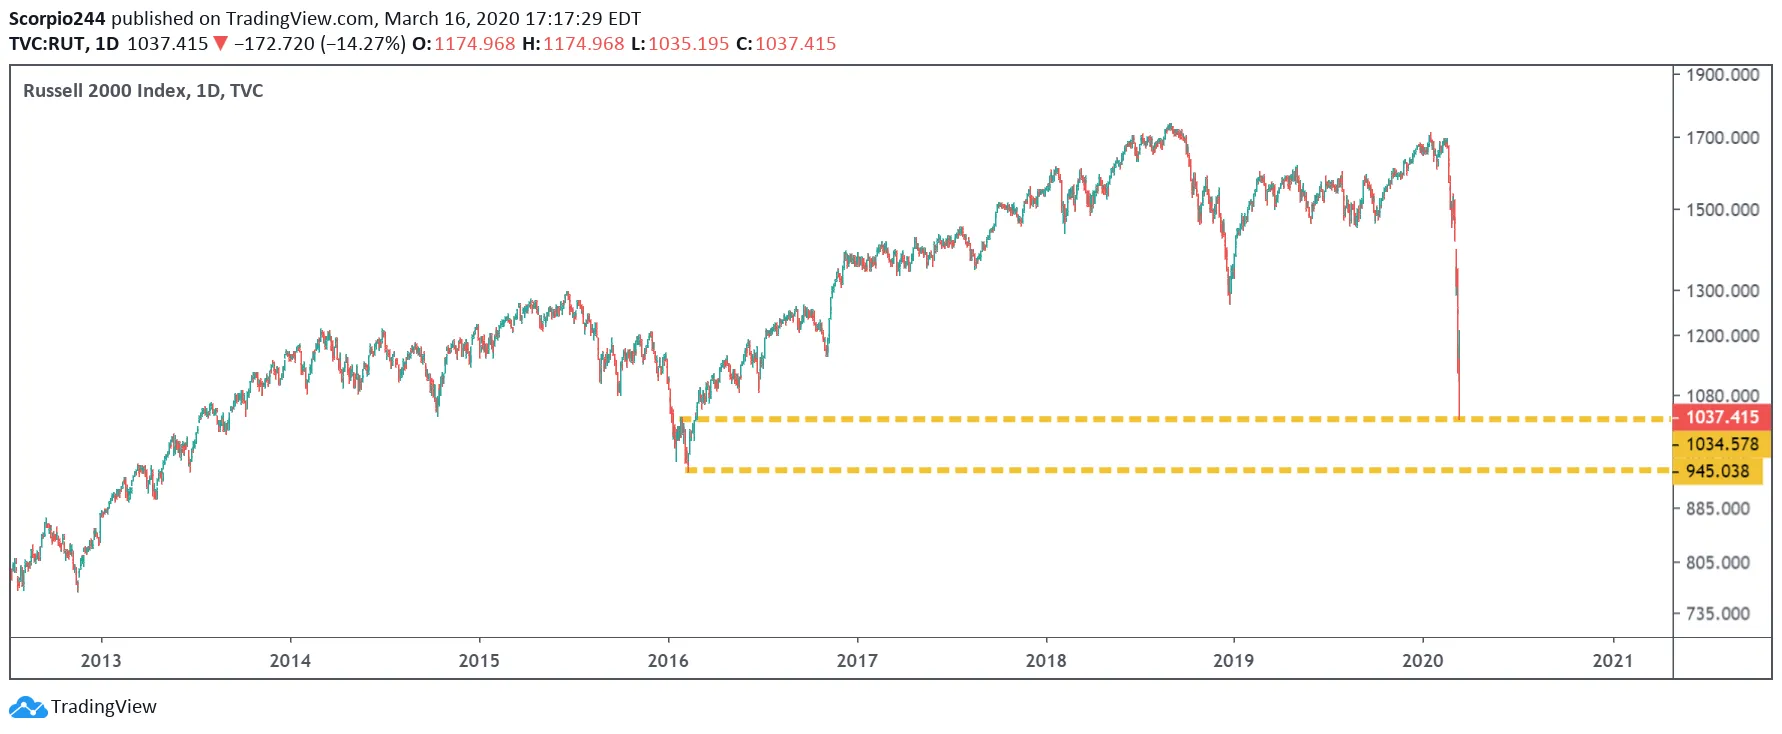
Meanwhile, the Russell 2000 is now trading at levels not seen since the Obama administration back in 2015. The first time we breached those levels on the way up was in 2013. After, 1,040, there is nothing until 950.
S&P 500 (SPY (NYSE:SPY))
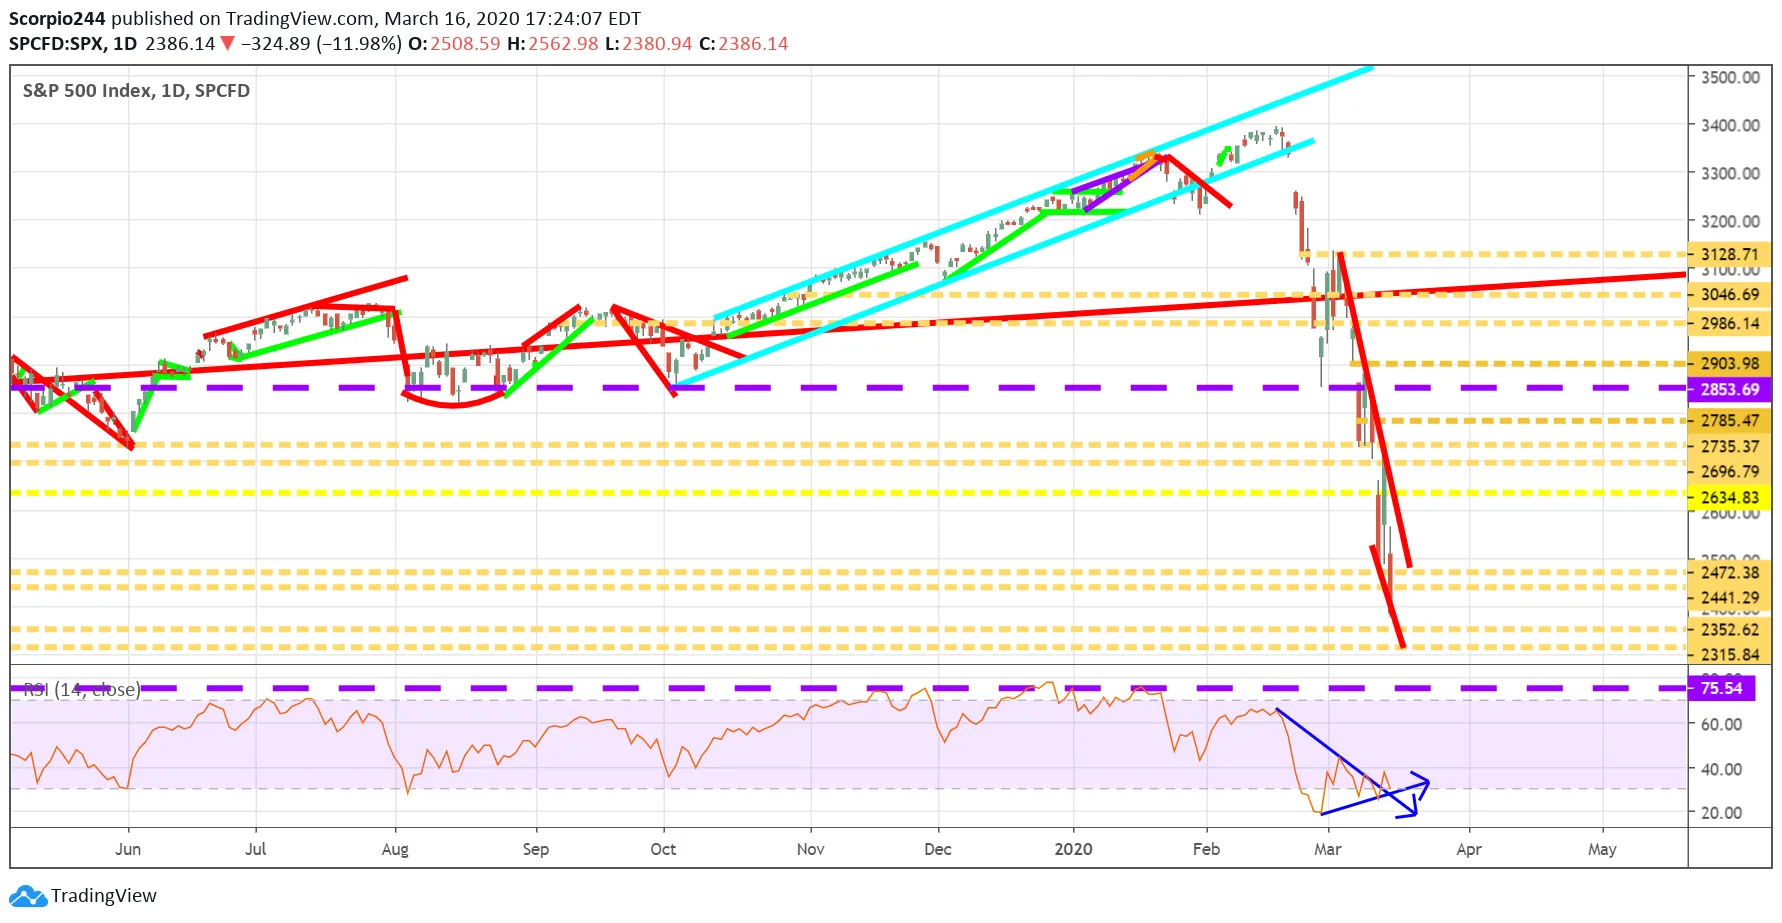
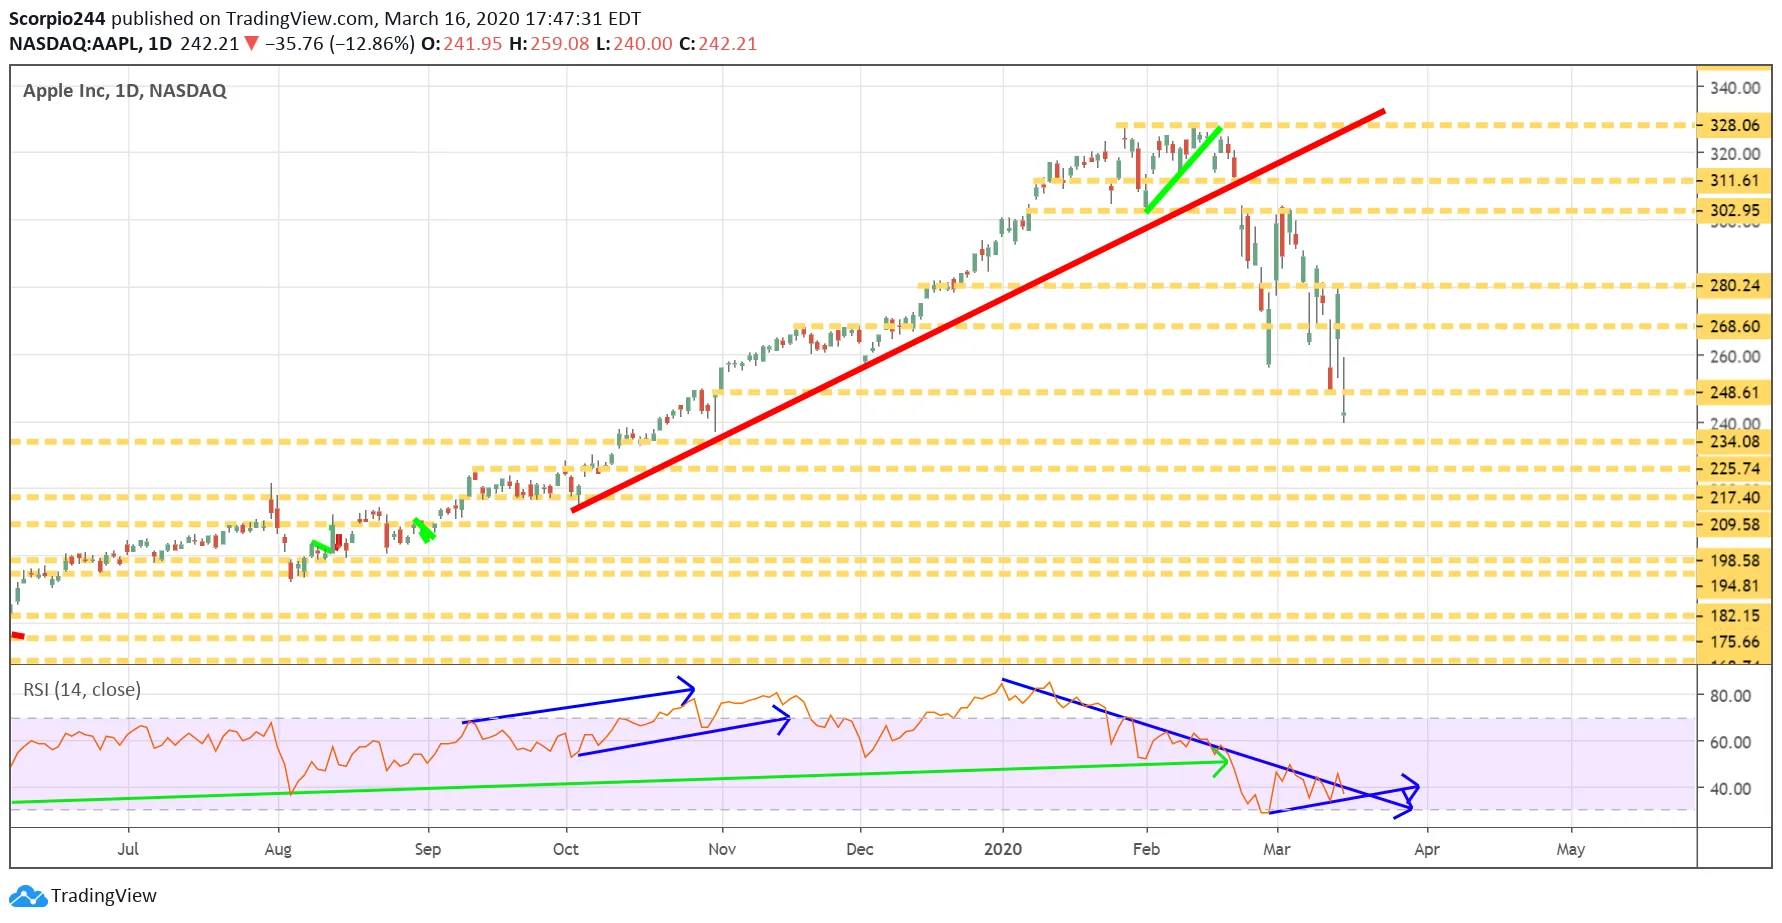
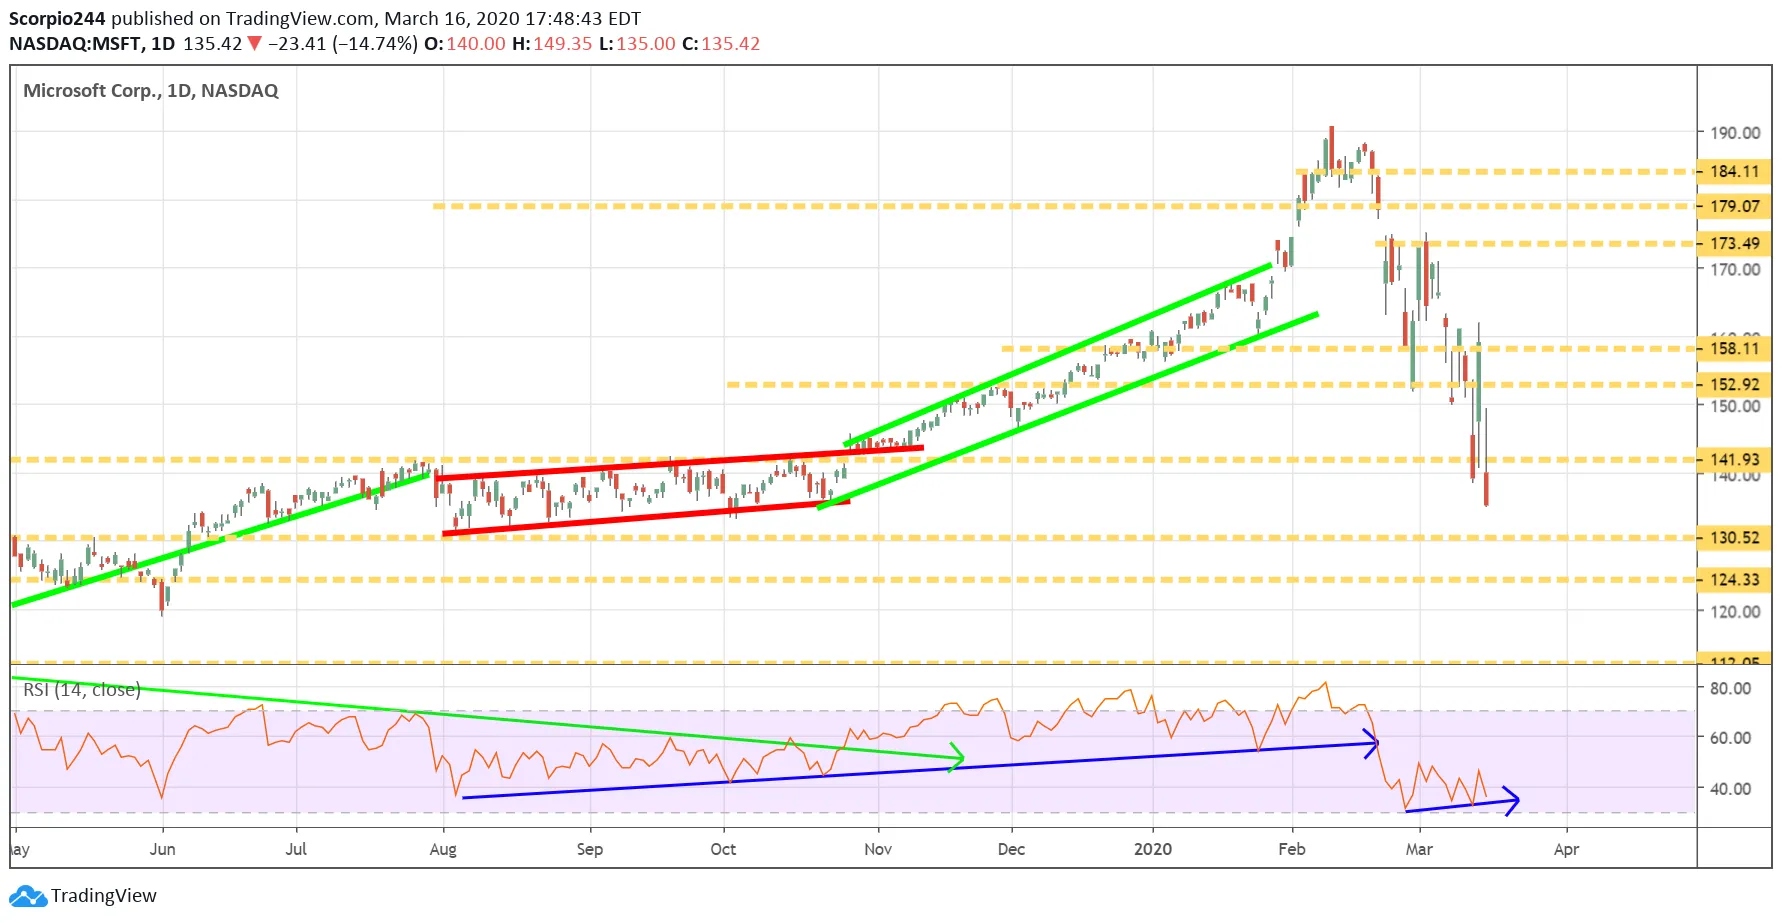
I’m almost afraid even to notate something positive from yesterday because first-off, there is nothing. Secondly, my positive views have been wrong; the only thing I can point to an RSI that is still trending higher. It continues to make that bearish divergence we have been following. When will it result in stocks turning? I don’t know, but a bullish divergence is a bullish reversal indicator.
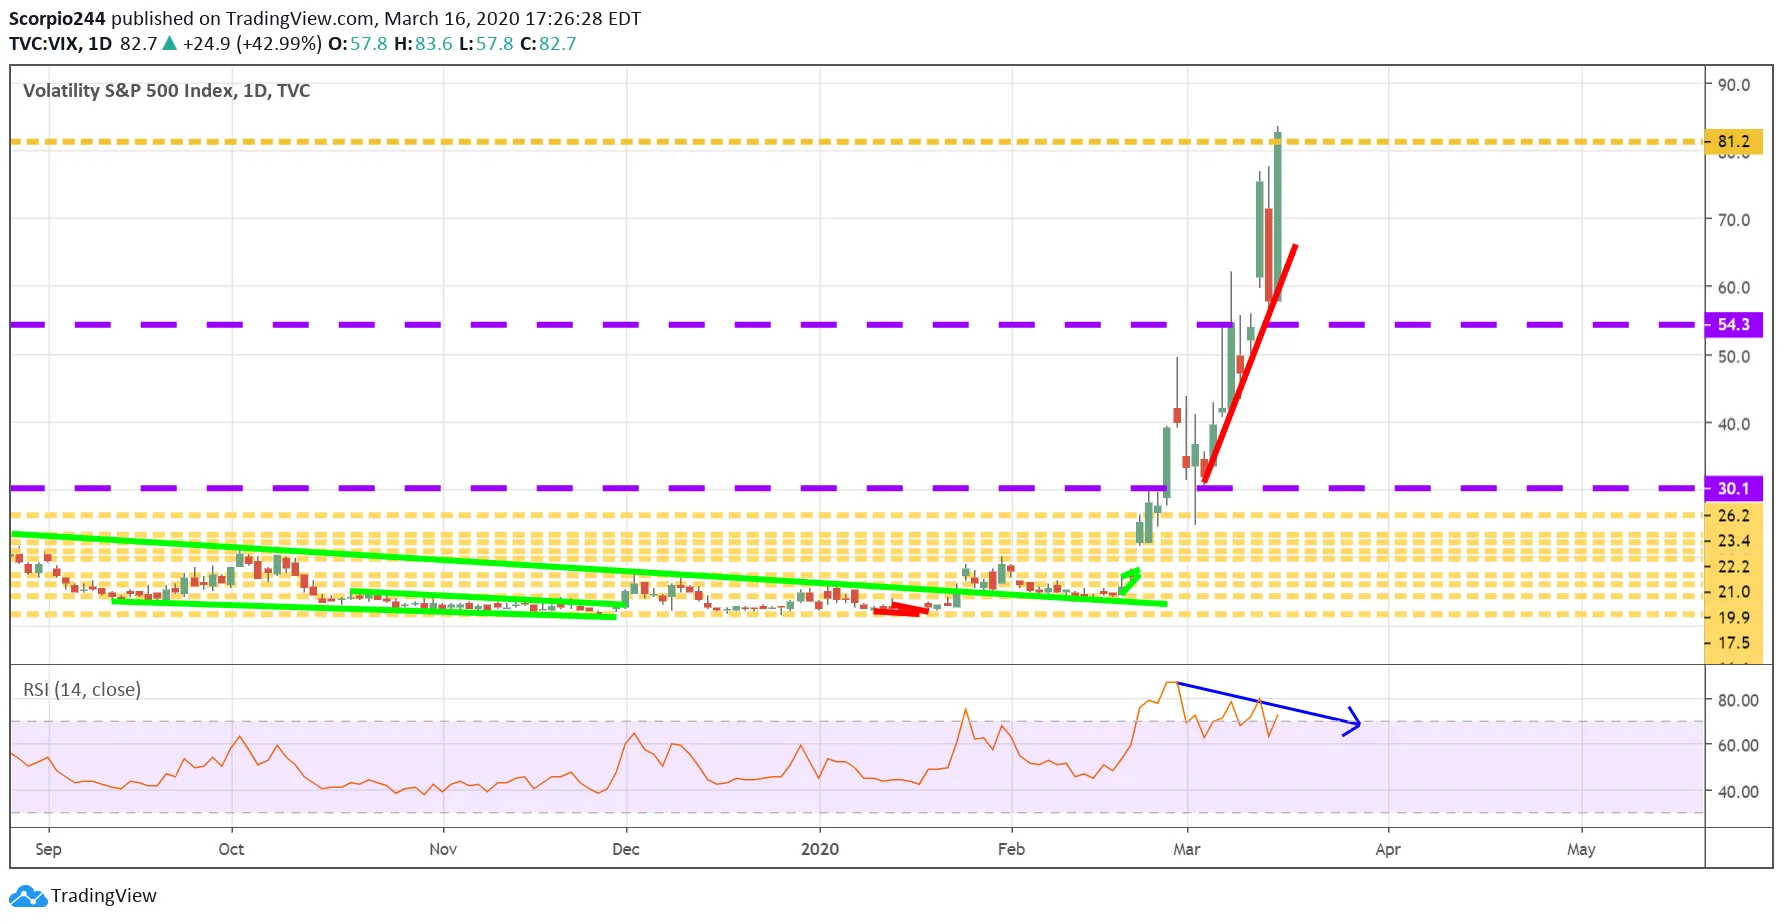
Meanwhile, the VIX is now above 80 and is working on a bullish divergence.
Also, there was some significant buying of the VIX $45 puts for expiration on April 15, with about 135,000 contracts. They traded on the ask suggesting they were bought to open. I usually would wait the extra day for the open interest change; however, in this case, I’m making an exception and bringing it up because again, it offers a glimmer of hope. They traded for about $6 per contract.
I also saw some buying of about 95,000 contracts of the $40 puts for expiration on May 20. They traded on the ask for around $8.80.
So if the open interest increases today, I would note these are huge trades on a dollar basis. So we can wait, these the first meaningful bets against the VIX I have seen this entire time.
Apple (AAPL)
Apple (NASDAQ:AAPL) also has the same bullish divergence forming
Microsoft (MSFT)
Microsoft (NASDAQ:MSFT) is too.
One day, when I am 70, I will be able to look back and be able to say to some 40-year-old hot-shot, this is nothing like 2020, much like how many people reflect on 1987, or 1929 for the generation before them. It seems each generation has a moment in time that stands out, for me it used to be 2008. Now, it is without a doubt, 2020. I have never witnessed anything like it, and I hope never to witness anything like it ever again.
Anyway, that’s all; I will leave it there. At least we know the sun will rise tomorrow, and life will go on, coronavirus or not, society will endure. With time, the economy and the market will recover, to bet against that, is to bet against a country that has given us all opportunities like no other has ever given to its citizens with hard work, it is a bet I’m not willing to take.
