There is a lot of event risk floating around.
If it isn't Chinese tariffs, it's a Trump administration investigation or Russian/Syrian turmoil. We've gone from a world seemingly without risks throughout most of 2017 and early 2018, to a world in which there are peripheral threats in every direction. That said, despite what it feels like, volatility isn't as high as it could be. Although we are seeing large point swings in the stock indices, the percentage of the swings is relatively reasonable given the height of the market and associated risks. Further, the VIX is relatively tame when compared to past volatility.
Where the ES goes in the short-run is obviously akin to a crap shoot. Nevertheless, looking back at historical patterns, it is generally a poor idea to bet against the S&P 500 as it is trading in a trough ahead of earnings season; earnings seasons have a tendency to reverse trends.
Treasury Futures Markets
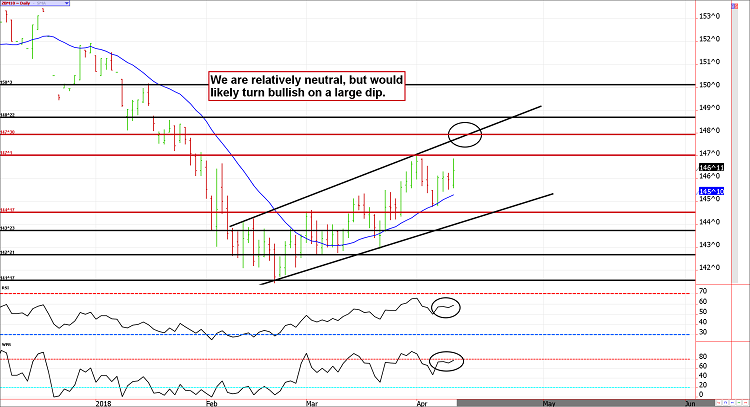
The lack of Treasury volatility is astounding.
Treasuries historically have been a safe-haven complex that benefits greatly from stock market turmoil. Yet, the 10-Year Note is trading within ticks of where it opened the month of February prior to the intense stock market decline. This is extraordinary for a market that is typically highly sensitive to uncertainty in other financial markets.
Due to the lack of volatility, we are hesitant to have open-ended risk (naked short options or unhedged futures) in this complex. It might not be today or even this month, but at some point, the volatility bug will bite Treasuries just as it did the equity market.
Treasury futures market consensus:
We are relatively neutral Treasuries, let's see what tomorrow brings.
**Technical Support:** ZB : 144'17, 143'23, 142'21, 141'17 and 140'19 ZN: 120'04, 119'26, 119'16 and 119'08
**Technical Resistance:** ZB: 147'07, 148'22, and 150'2 ZN: 121'15, and 122'01
Stock Index Futures
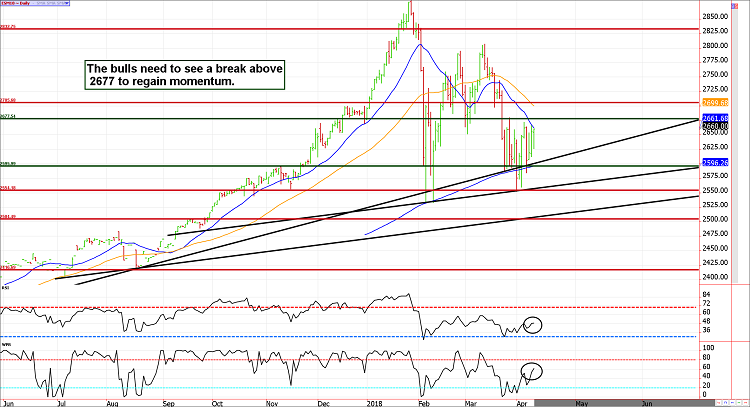
The best trades in the ES are probably from the long side of the market on big dips.
As mentioned above, betting against a down market going into earnings season generally doesn't work out well. Unfortunately for the bulls, that doesn't mean the market will go straight up without any stress. In fact, it is the opposite, we are probably in store for a continuation of the large price swings. Nevertheless, any large sell-off is probably best played from the upside. In addition, to a potentially positive earnings season, we are entering a seasonal "buy" time-frame and technical support near 2550 has held nicely.
Stock Index Futures Market Ideas
**E-mini S&P Futures Market Consensus:**
Getting bullish on large dips will probably yield the best trades.
**Technical Support:** 2595, 2550, 2530, and 2504
**Technical Resistance:** 2677, 2705, 2744, 2799, 2830, and 2882
E-mini S&P Futures Day Trading Ideas
**These are counter-trend entry ideas, the more distant the level the more reliable but the less likely to get filled**
ES Day Trade Sell Levels: 2669 (minor), 2688, 2702, and 2744
ES Day Trade Buy Levels: 2627(minor), 2604, 2590, 2565, 2546, 2531, and 2504
In other commodity futures and options markets....
January 30 - Buy June ZN near 121'09, sell an April 121 call and buy a March 120 put as catastrophic insurance.
February 15 - Sell May ZN 121 call to refresh bullish ZN position hedge.
February 20 - Buy back April 121 ZN call to lock in gain, sell March ZN put near breakeven.
February 21 - Sell long June ED 98 put to lock in a profit of anywhere from $550 to $600. This leaves our long futures contract underwater and "naked".
March 2 - Sell May Soybean Meal Futures near 3.95, sell a May 3.95 put then buy an April 4.30 call for insurance.
March 8 - Sell a June 121 10-year note call against the long futures position (hold short May 121 call).
March 15 - Exit covered put in May soybean meal to lock in a gain of about $850 prior to transaction costs.
March 20 - Go long June soybean meal futures near 363 and sell a June 360 call against it. Purchase a May 340 put for catastrophic insurance.
March 20 - Buy back May ZN 121 call to lock in the profit (roughly $250 per lot before transaction costs) and sell the June 121 call for about 30 ticks to freshen up the hedge going into the Fed meeting (this leaves the position with a long June 10-year note futures contract and 2 short 121 calls).
March 21 - Sell the June live cattle 102 put and purchase the April cattle 113 put for insurance (the April cattle is trading much higher than June).
March 23 - Go long July Corn Futures, buy a July 3.80 put and sell a July 4.10 call. The net out of pocket expense and risk is roughly 7.5 cents or $375, max profit potential is about $1,050 before commissions and fees.
March 27 - Go long July Sugar 13.50 calls near 27 ticks or roughly $300.
March 28 - Go long July lean hogs near 75.70, sell a July 76 call for about 4.00 ($1600), then purchase a 64 put near 50 ($200).
April 2 - Sell long April cattle 113 put at a moderate profit. Use the proceeds to purchase a May 97 put as insurance against our short June 102 put.
April 5 - Exit bullish soybean meal long futures contract and short 360 put to lock in an overall profit of roughly $700 before considering transaction costs; hold the May 340 put in hopes of a reversal.
April 6 - Go long May soybean $10.70 calls for about 3 cents ($150).
**There is substantial risk of loss in trading futures and options.** These recommendations are a solicitation for entering into derivatives transactions. All known news and events have already been factored into the price of the underlying derivatives discussed. From time to time persons affiliated with Zaner, or its associated companies, may have positions in recommended and other derivatives. Past performance is not indicative of future results. The information and data in this report were obtained from sources considered reliable. Their accuracy or completeness is not guaranteed. Any decision to purchase or sell as a result of the opinions expressed in this report will be the full responsibility of the person authorizing such transaction. Seasonal tendencies are a composite of some of the more consistent commodity futures seasonals that have occurred over the past 15 or more years. There are usually underlying, fundamental circumstances that occur annually that tend to cause the futures markets to react in a similar directional manner during a certain calendar year. While seasonal trends may potentially impact supply and demand in certain commodities, seasonal aspects of supply and demand have been factored into futures & options market pricing. Even if a seasonal tendency occurs in the future, it may not result in a profitable transaction as fees and the timing of the entry and liquidation may impact on the results. No representation is being made that any account has in the past, or will in the future, achieve profits using these recommendations. No representation is being made that price patterns will recur in the future.
