📈 Will you get serious about investing in 2025? Take the first step with 50% off InvestingProClaim Offer

Watch The Volatility Index

Published 12/23/2016, 12:33 PM
Updated 07/09/2023, 06:31 AM
US500
-
VIX
-
VVIX
-

One of the great things about being a technician is the ability to constantly explore new charts and look at markets from all angles. The Volatility Index (VIX) has gotten a lot of attention lately as it gets to historically low levels. Charlie Bilello, CMT pointed out that the VIX earlier this month was down 48% in the prior 5 weeks, marking the 2nd largest five-week decline in history. Today I want to look at what I believe to be a unique ratio chart -- the S&P 500 and the Volatility of the VIX.

This ratio compares the relative performance of the S&P 500 equity market to the Volatility of the Volatility Index. What I’m most interested in is how momentum of this ratio acts and the timing of moves for the VIX itself. And that’s exactly what I’m looking for in this ratio chart below. When the two-week Relative Strength Index (RSI) for the S&P 500-VVIX ratio -- shown in the bottom panel -- moves above 70 (becoming ‘overbought’) and then declines as the VIX itself declines, it has marked some interesting turning points for the Volatility Index and has often marked the eventual low (or close to it) for the VIX.

This is a setup that’s taking place right now as the VIX drops under 12. It’s possible we see the VIX go higher from here, but over what time frame, we do not know. As of this post, the VIX is up and we’ll see if that continues as we finish out the year.
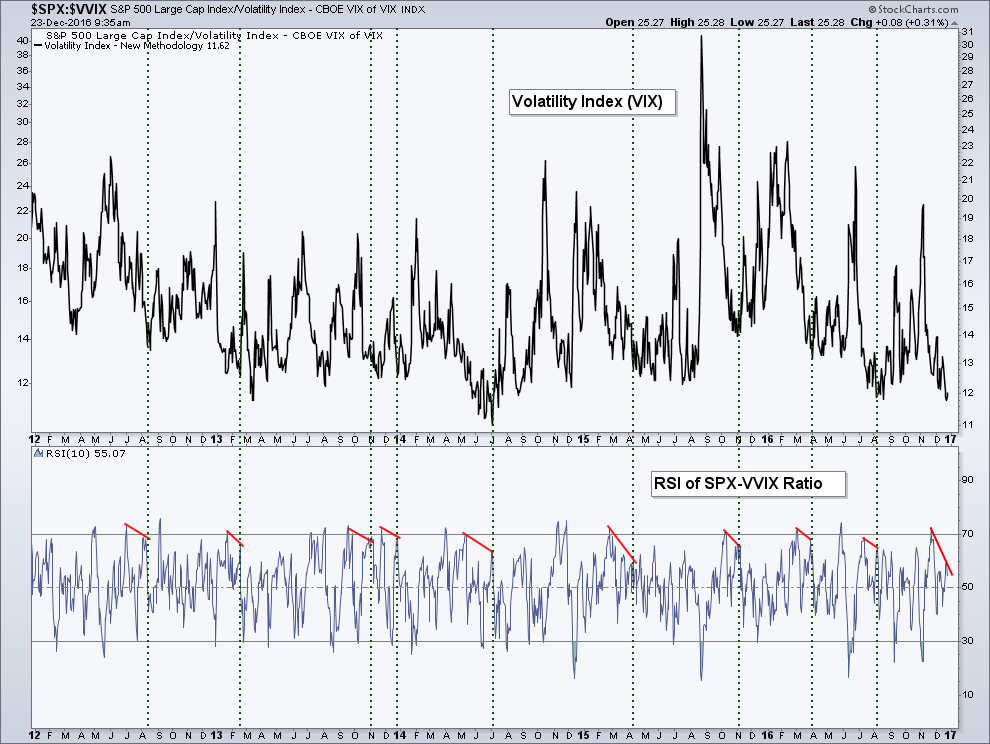
Volatility (top), S&P 500 & Volatility Of The VIX

Merry Christmas.

Latest comments

Loading next article…
Risk Disclosure: Trading in financial instruments and/or cryptocurrencies involves high risks including the risk of losing some, or all, of your investment amount, and may not be suitable for all investors. Prices of cryptocurrencies are extremely volatile and may be affected by external factors such as financial, regulatory or political events. Trading on margin increases the financial risks.
Before deciding to trade in financial instrument or cryptocurrencies you should be fully informed of the risks and costs associated with trading the financial markets, carefully consider your investment objectives, level of experience, and risk appetite, and seek professional advice where needed.
Fusion Media would like to remind you that the data contained in this website is not necessarily real-time nor accurate. The data and prices on the website are not necessarily provided by any market or exchange, but may be provided by market makers, and so prices may not be accurate and may differ from the actual price at any given market, meaning prices are indicative and not appropriate for trading purposes. Fusion Media and any provider of the data contained in this website will not accept liability for any loss or damage as a result of your trading, or your reliance on the information contained within this website.
It is prohibited to use, store, reproduce, display, modify, transmit or distribute the data contained in this website without the explicit prior written permission of Fusion Media and/or the data provider. All intellectual property rights are reserved by the providers and/or the exchange providing the data contained in this website.
Fusion Media may be compensated by the advertisers that appear on the website, based on your interaction with the advertisements or advertisers.
© 2007-2025 - Fusion Media Limited. All Rights Reserved.