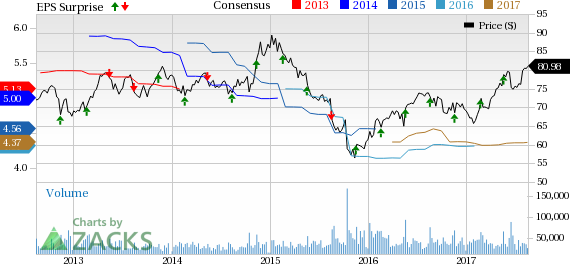
Wal-Mart Stores Inc. (NYSE:WMT) reported better-than-expected second-quarter fiscal 2018 results, wherein both earnings and revenues exceeded the Zacks Consensus Estimate. The company has also raised the lower end of its fiscal 2018 earnings guidance.
If we look into the last six months’ performance, we note that Wal-Mart’s shares have rallied 16.7% in the said time frame, higher than the industry, which grew 10.8%. The broader Retail-Wholesale sector has increased 9.7% in the last six months.

Quarter in Detail
Wal-Mart’s second-quarter fiscal 2018 adjusted earnings of $1.08 per share beat both the Zacks Consensus Estimate and prior-year quarter’s adjusted earnings of $1.07 by 0.9%. Earnings reached the top end of the guided range of $1.00-$1.08 per share.
Total revenues came in at $123.4 billion (including membership and other income). The figure came ahead of the Zacks Consensus Estimate of $122.7 billion by 0.5% and increased 2.1% year over year. Currency impacted sales by approximately $1.04 billion. The decline in the International business was more than offset by growth in sales at Wal-Mart U.S and Sam’s Club divisions. On a constant currency basis, revenues improved 2.9% to $124.4 billion.
Total revenues comprised net sales of $121.9 billion (up 2.1% from the year-ago quarter and up 3.0% on a constant currency basis) and membership and other income of $1.4 billion (down 3% year over year).
Operating income declined 3.2% to $5.97 billion in the reported quarter as the company continued to invest in e-Commerce initiatives to compete with the online retailer Amazon.com, Inc. (NASDAQ:AMZN) . Currency had a negative impact of $100 million on the same. On a constant currency basis, operating income declined 1.6%.
Segment Details
Wal-Mart U.S.:The segment posted net sales growth of 3.3% to $78.7 billion in the reported quarter, including the impact of fuel sales. Operating income increased 2.2% to $4.6 billion, despite incurring huge expenses as a result of e-Commerce initiatives.
U.S. same-store sales (comps) for the 13-week period ended Jul 28 increased 1.9% compared with 1.6% comps growth in the prior-year quarter. This was the 12th consecutive quarter of positive comps. Comp sales growth reached the top end of the company’s expectations of 1.5-2.0% increase. While comp traffic improved 1.3%, average ticket inched up 0.5% in the quarter. The impact of rising consumer spending has been witnessing in improved traffic for the last 11 quarters now. e-Commerce sales positively impacted comp sales at Wal-Mart U.S. by 0.70%.
Wal-Mart International:Segment net sales, including fuel sales, declined 1.0% year over year to $28.3 billion. The same, however, increased 2.5% on a constant currency basis to $29.3 billion. Operating income declined 7.8% to $1.6 billion. On a constant currency basis, it declined 2.0%.
Amid a soft global economic scenario and currency headwinds, Wal-Mart is grappling with slower sales and tough price competition in Asia. International revenues have been declining since first-quarter fiscal 2016.
Sam’s Club:The segment, which comprises membership warehouse clubs, posted net sales growth, including fuel impact, of 2.3% to $14.9 billion. Sam’s Club, however, reported operating income decline of 14.4% to $404 million in the quarter.
Sam’s Club comps, excluding the impact of fuel sales, rose 1.2% compared with a growth of 0.6% in the prior-year quarter. Comp sales growth was within the company’s expectations of 1-1.5% growth. Comp traffic grew 2.1%, while ticket decreased 0.9%. e-Commerce sales positively impacted comps by approximately 0.8% in the quarter.
Other Financial Updates
Wal-Mart ended the quarter with cash and cash equivalents of $6.5 billion, total long-term debt of $33.7 billion, long-term capital lease obligations of $6.8 billion and shareholders’ equity of $76.4 billion.
At the end of second-quarter fiscal 2018, Wal-Mart generated cash flow from operations of $11.4 billion and incurred capital expenditures of $4.2 billion, resulting in free cash flow of $6.9 billion.
Wal-Mart paid $1.5 billion in dividends during the quarter. The company repurchased about 30 million shares worth $2.3 billion in the quarter, with shares worth $4.8 billion remaining out of $20 billion authorized in Oct 2015.
Guidance
Third-Quarter Fiscal 2018
Wal-Mart expects U.S. comp sales growth in the range of 1.5-2.0% for the 13-week period ending Oct 27. Sam’s Club comp sales, without the impact of fuel sales, are expected to increase 1-1.5%. The company expects adjusted earnings in the range of 90 cents to 98 cents per share.
Fiscal 2018
The company has raised the lower end of its fiscal 2018 earnings guidance during the current quarter and now expects adjusted earnings in the range of $4.30-$4.40 per share, as compared with the prior expectation of $4.20-$4.40 per share, announced during fourth-quarter fiscal 2017.
Our Take
Despite the company’s efforts to boost sales and regain investors’ confidence, it still faces many headwinds, which are likely to impact earnings in the near term. Higher e-Commerce investments, declining international sales and currency headwinds are also expected to impact the results negatively.
Zacks Rank and Key Picks
Wal-Mart currently carries a Zacks Rank #2 (Buy).
Some other top-ranked stocks in the retail space include The Children’s Place, Inc. (NASDAQ:PLCE) and Canada Goose Holdings Inc. (NYSE:GOOS) . Both the stocks carry a Zacks Rank #2. You can seethe complete list of today’s Zacks #1 Rank (Strong Buy) stocks here.
While The Children’s Place has an expected long-term earnings growth of 9.0%, Canada Goose has an expected earnings growth of 34.1%, for the next three to five years.
One Simple Trading Idea
Since 1988, the Zacks system has more than doubled the S&P 500 with an average gain of +25% per year. With compounding, rebalancing, and exclusive of fees, it can turn thousands into millions of dollars.
This proven stock-picking system is grounded on a single big idea that can be fortune shaping and life changing. You can apply it to your portfolio starting today.
Amazon.com, Inc. (AMZN): Free Stock Analysis Report
Children's Place, Inc. (The) (PLCE): Free Stock Analysis Report
Canada Goose Holdings Inc. (GOOS): Free Stock Analysis Report
Wal-Mart Stores, Inc. (WMT): Free Stock Analysis Report
Original post

