50% Off! Beat the market in 2025 with InvestingProCLAIM SALE

Wall Street Reining In Its 7-Year Cycle?

Published 10/14/2014, 02:10 AM
Updated 07/09/2023, 06:32 AM
US500
-

Stock Market Technical Analysis

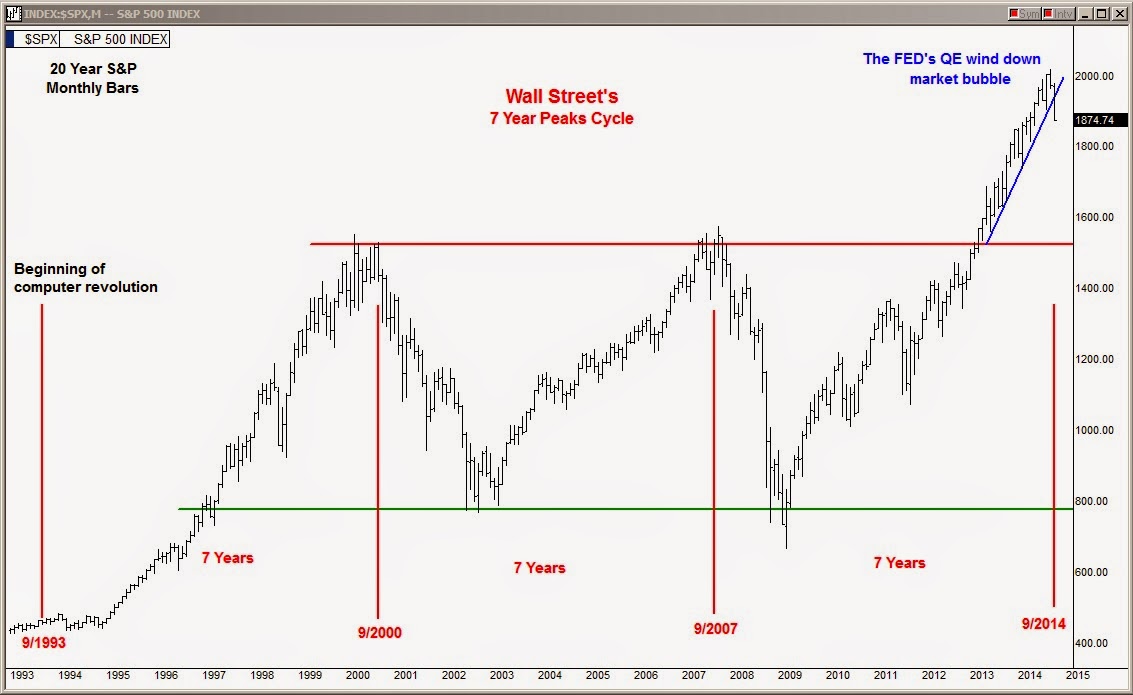
In the market Monday, we had additional technical failures once again. The S&P 500 has suffered small, medium, and large EMA down crosses in the past two weeks. It has fallen out of its two-year Fed bubble channel shown with blue lines in this chart. Plus, it has also sliced through its 200 day line today as if it were butter and the selling only appears to be increasing. It may be time to seriously consider if Wall Street has begun reining in its 7-year cycle.

Over the past twenty years Wall Street has been maintaining a cycle whereby the market peaks every seven years. It was used heavily in earlier decades but during the late eighties it stopped. Then as the computer revolution began in the early nineties the 7-year cycle began again. In the chart I have posted, it shows the three 7-year spans each culminating to a peak at the end of the month of September in the years 2000, 2007, and now 2014.

Studying the chart closely, it's easy to assess that the 2-year stock market bubble has just burst as we slipped out of the blue line, super steep, 2-year channel and it happened right as the third seven year span came to a close last month.

Latest comments

Loading next article…
Risk Disclosure: Trading in financial instruments and/or cryptocurrencies involves high risks including the risk of losing some, or all, of your investment amount, and may not be suitable for all investors. Prices of cryptocurrencies are extremely volatile and may be affected by external factors such as financial, regulatory or political events. Trading on margin increases the financial risks.
Before deciding to trade in financial instrument or cryptocurrencies you should be fully informed of the risks and costs associated with trading the financial markets, carefully consider your investment objectives, level of experience, and risk appetite, and seek professional advice where needed.
Fusion Media would like to remind you that the data contained in this website is not necessarily real-time nor accurate. The data and prices on the website are not necessarily provided by any market or exchange, but may be provided by market makers, and so prices may not be accurate and may differ from the actual price at any given market, meaning prices are indicative and not appropriate for trading purposes. Fusion Media and any provider of the data contained in this website will not accept liability for any loss or damage as a result of your trading, or your reliance on the information contained within this website.
It is prohibited to use, store, reproduce, display, modify, transmit or distribute the data contained in this website without the explicit prior written permission of Fusion Media and/or the data provider. All intellectual property rights are reserved by the providers and/or the exchange providing the data contained in this website.
Fusion Media may be compensated by the advertisers that appear on the website, based on your interaction with the advertisements or advertisers.
© 2007-2024 - Fusion Media Limited. All Rights Reserved.