Drugstore and pharmacy chain Walgreens Boots Alliance (NASDAQ:WBA) stock is still underperforming the benchmark S&P 500 index as it recovers from the panic sell-off on the Amazon Pharmacy (NASDAQ:AMZN) rollout announcement. The Company has been a major COVID-19 testing provider and will also be a critical vaccine distributor upon FDA approval of COVID-19 vaccines.
Shares have been depressed ahead of the pandemic as bipartisan efforts to reign in drug pricing cuts into pharmacy benefits managers (PBM) margins. These headwinds continue to gain steam with the Biden administration, but the pandemic has enabled the Company to be an essential player in the nation’s and global return to normalcy. Prudent investors can watch for opportunistic pullback levels to scale in positions.
Q4 FY 2020 Earnings Release
On Oct. 15, 2020, Walgreens WBA an earnings-per-share (EPS) profit of $1.02 excluding non-recurring items versus consensus analyst estimates for a profit of $0.96, a $0.06 beat. Revenues grew 2.33% year-over-year (YoY) to $34.75 billion, beating analyst estimates by $381.92 million. Boots.com online digital sales grew 155% YoY while Walgreens.com digital sales grew 39% YoY. The U.K. segment was exceptional weak as retail comps fell (-29.2%) due to COVID-19 restrictions as the country deals with another wave of spread. The Company estimates FY 2021 adjusted EPS growth to return to single digits versus the FY2020 (-20.6%) EPS shortfall, anticipating a second-half recovery in 2021.
Conference Call Takeaways
Walgreens CEO, Stefano Pessina, noted the effects of COVID-19 impacted the second-half of 2020 the most, but signs of improvement in customer trends at the end of the last quarter. Full-year 2020 adjusted EPS fell (-20.6%) YoY to $4.74, an estimated (-$1.06) EPS can be attributed to the financial impacts of COVID-19. The Transformational Cost Management Program (TCMP) is still estimated to deliver $2 billion in annual run-rate cost savings by 2022. Operating cash flow was $5.5 billion. Free cash flow was $4.1 billion, growing at 5.6%. Retail Pharmacy U.S.A. sales grew 3.6% YoY, including the impact of store closures. Total pharmacy sales rose 4.2% YoY in the quarter. This included central specialty growth of 12.5%. Retail sales in the U.S. grew 1.2% YoY.
U.K. Boots Stores
The Company quickly adapted to market conditions and extended fulfillment capabilities with in-store pick up available in 90% of the stores. The Company provided over a million COVID tests completed for the National Health System (NHS) in the U.K. A restructuring model is currently underway, which include a (-7%) reduction in the Boots U.K. and Boots Opticians workforce. The Company is expanding its digital development omnichannel investments to $1 billion in 2021, a $165 million YoY increase.
Programs
To better compete with the wave of prescription discounting services, the Company relaunched its Prescription Savings Club offering. This service provides lower prices on hundreds of medications. The average weekly enrollment increased over 400% YoY since June resulting in a saving of over $164 million for its club members. Rx Coverage Advisor and Find Care Platform were launched which enable customers to seek personalized guidance on health and prescription drug coverage options as well as connecting patients to telehealth providers. Traffic to the programs increased by 36X YoY to 8.5 million visits. The Company continues to invest in “mass personalization” with more targeted interactions. The Company relaunched its customer loyalty program myWalgreens with an updated app enabling members to earn 5% Walgreens cash on owned brand products and 1% on other qualifying products. Currently, there are over 100 million myWalgreens loyalty members. Customers now have the ability to order in-app or online and pickup in-store in 30-minutes. Prudent investors looking for a return to normalcy play heading into 2021 can watch shares of WBA for opportunistic pullback levels.

WBA Opportunistic Pullback Levels
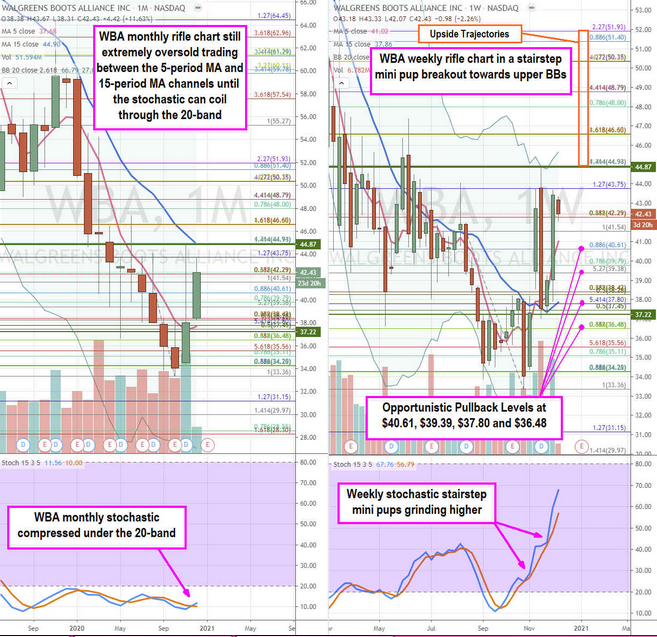
Using the rifle charts on the monthly and weekly time frames enables a broader view of the playing field. The monthly rifle chart is still very oversold as indicated by the smothered stochastic still under the 20-band. Shares are attempting a channel tightening within the monthly 5-period moving average (MA) at the $37.80 Fibonacci (fib) level and the 15-period MA at the $44.87 monthly market structure low (MSL) trigger.
The weekly rifle chart has been busy grinding higher driven by stairstep stochastic mini pups with the rising 5-period MA at $41.02. Opportunistic pullback levels sit at the $$40.61 fib, $39.38 fib, $37.80 fib and the $36.48 fib. The upside trajectories range from the $44.87 fib up towards the $51.93 fib. Traders can also watch peers CVS Health (NYSE:CVS) and Rite Aid (NYSE:RAD).
