It is difficult to tune in any financial program without hearing someone warning of an imminent market correction. Does that mean conservative investors should be moving to the sidelines and going largely to cash? Let’s apply to solid analysis to this question rather than falling for the emotional plea of the doomsday gurus.
The S&P 500 put on a strong run higher from September 27th through October 5th, up 49 points or 2% in seven trading sessions. But last week’s trading results were much more modest, up only two points, essentially unchanged. SPX opened this morning at 2556 and is trading sideways. Are the bulls losing momentum or is this just one more pause in this lengthy bull market? Another way to measure this past week is to note that three of five days were down days and one trading session yielded a doji candlestick, the classic mark of indecision. And it looks like today’s trading in SPX may yield another doji candlestick.
Trading volume of the S&P 500 companies hit a recent low last Monday at about 1.4 billion shares, well below the 50-day moving average at 1.8 billion shares. But trading volume rose the rest of the week, breaking above the 50 dma on Thursday and dipping back a bit Friday, but remaining above the 50 dma. I have to wonder if the lack of progress on tax reform in the Congress is beginning to weigh on this market. I believe this market has priced in tax reform, but many analysts are beginning to doubt Congress’ willingness to pass the administration’s plan. Time is running out.
The Russell 2000 Index (RUT) continued the decline that began the previous week, opening Monday at 1510 and closing at 1502. RUT opened at 1503 this morning and is modestly lower at 1500 as I write this article. These are small losses, but the down trend is becoming clear. The nature of the Russell 2000 index, composed largely small to mid-capitalization stocks, leads me to conclude that money managers are closing their high beta positions, thereby reducing risk. Perhaps they are anticipating a breather or even a minor pull back.
The Standard and Poors 500 volatility Index (VIX) spiked up a bit last Monday, but had returned to historically low values by Friday, closing at 9.6%. Today, Monday, 10/16, VIX opened up a little higher at 9.95%, but this remains historically low. I keep a close eye on VIX. Many market analysts have been predicting a correction simply because VIX has been running at historically low levels. The key is to watch for an increasing trend higher in VIX. VIX is the early warning signal for the correction.

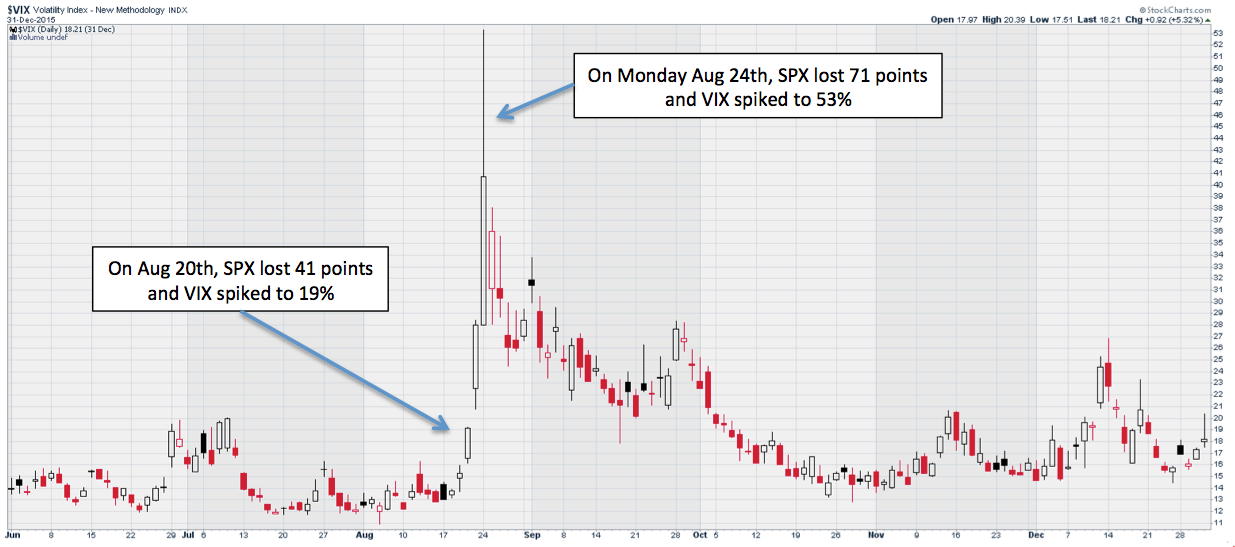
Let’s examine the flash crash of 2015 for pointers on impending corrections. I plotted VIX above for the period of June 1st through the end of the year in 2015. The S&P 500 lost 41 points on Thursday, August 20th and VIX popped up to 19%. That was the early warning signal. I closed my positions on Thursday. At a minimum, one should have closed on Friday as VIX rose to 28%. The flash crash occurred on Monday as SPX lost 71 points and VIX spiked to 53% intraday. SPX hit its low on Tuesday at 1867, a net loss of 10% from Thursday’s open. The flash crash on Monday was predicted by the previous two days of spiking VIX values.
I track VIX because it shows us when the largest institutional money managers are beginning to be concerned. And right now, they are as calm as they have been in years. Don’t let the doomsday gurus spook you. You don’t want to miss out on this huge bull market. But we could see a pull back or correction at any time. At a minimum, add trailing stops to your stock positions and contingency stop loss orders to your option positions. Continue to trade from a bullish posture, but keep your stops tight.
