The Cboe Volatility Index (VIX considered the stock market's "fear gauge" -- has dropped roughly 16% already in August, and today is eyeing a sixth straight loss and its lowest close since January. However, recent VIX options activity suggests traders are speculating on (or hedging against) a surge for the index.
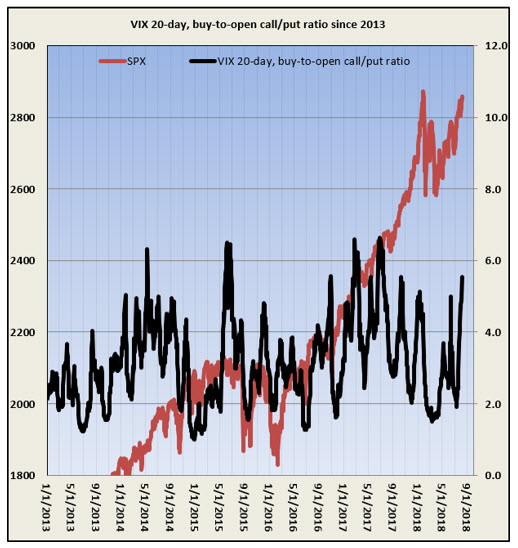
The VIX 20-day buy-to-open (BTO) call/put ratio has been rising in recent weeks, and recently clocked in at 5.55 -- the highest since mid-July 2017 (during a similar Nasdaq winning streak, in fact). Echoing that, the 30-day implied volatility skew on VIX options is now at an annual low, suggesting near-term puts have rarely been cheaper than calls in the past year.

In the past two weeks, the deep out-of-the-money VIX December 47.50 call has seen the biggest surge in open interest, with more than 113,000 contracts added. With the VIX currently just below 11, the fear index would need to more than quadruple by the end of the year for these calls to move into the money. Meanwhile, the September 20 and 21 calls, as well as the October 25 call, each saw more than 55,000 contracts added in the past two weeks.
Perhaps some of the recent out-of-the-money VIX call buying is attributable to shorts seeking an options hedge. As of July 31, Commitments of Traders (CoT) data showed large speculators -- a group that has been notoriously wrong on VIX -- were net short VIX futures by the most since mid-December. Plus, the VIX has been known to burst higher in the August-October period.
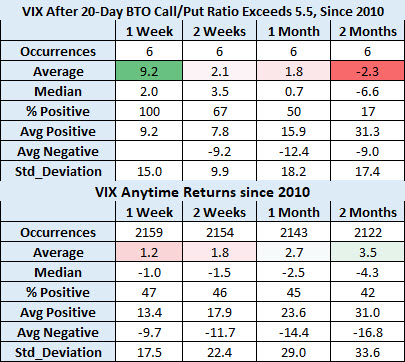
Whatever the motive, the Cboe Volatility Index has historically popped a week after its 20-day BTO call/put ratio exceeds 5.5. According to data from Schaeffer's Quantitative Analyst Chris Prybal, the VIX has averaged a one-week gain of 9.2%, and was higher 100% of the time after signals since 2010, of which there have been six. That's compared to an average anytime one-week gain of just 1.2%, with a positive rate of 47%, looking at VIX data since 2010.
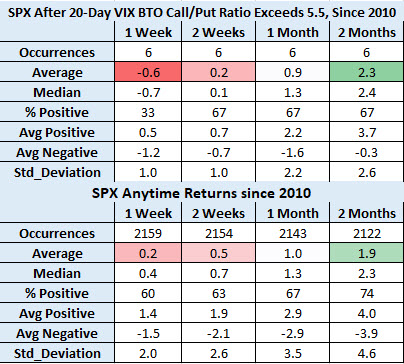
Likewise, the S&P 500 Index (SPX) tends to dip after the VIX 20-day BTO call/put ratio tops 5.5. One week later, the SPX was down 0.6%, on average, and higher just 33% of the time. That's compared to an average anytime one-week return of 0.2%, with a 60% win rate, looking at data since 2010.
By two months later, however, the VIX has typically reversed lower. The fear gauge was down 2.3%, on average, and higher just once after the last six signals. The S&P 500, meanwhile, was up 2.3%, on average, two months after a VIX options signal -- slightly better than its average anytime two-month gain of 1.9%.


