Investing.com’s stocks of the week
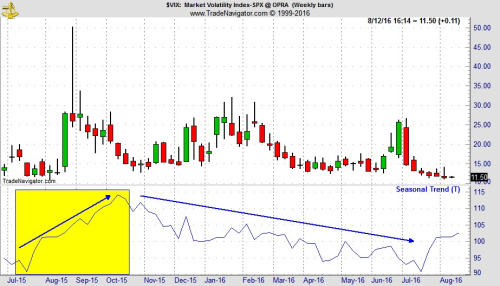
In the following chart, weekly bars of CBOE’s Volatility Index (VIX) are plotted with its 1-year seasonal pattern plotted below. In an average year, VIX typically reaches a low in July and then begins to steadily climb toward a high sometime during October and then begin to decline once again. Note how over the last year VIX has tracked its seasonal pattern rather closely.

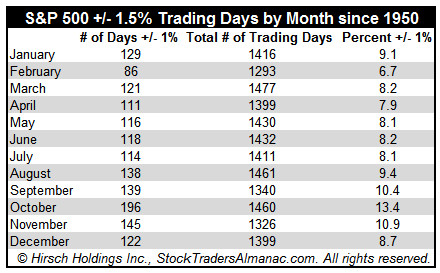
Since VIX does not measure actual volatility (daily price moves), let’s compare it to actual daily price swings of the S&P 500 since 1950. In the following table, the number of trading days where S&P 500 closed up or down greater than or equal to 1.5% appears next to the month. In the third column the total number of trading days in that month appears. Lastly the percentage of days greater than or equal to +/- 1.5% is calculated. August has the fourth highest percentage of days +/- 1.5%. October has the most which matches the 1-year seasonal pattern above.

