🔺 What to do when markets are at an all-time high? Find smart bargains, like these.See Undervalued Stocks

Viewing Some Important ETFs

Published 07/17/2018, 12:27 AM
Updated 07/09/2023, 06:31 AM
NDX
-
XAU/USD
-
XAG/USD
-
INTC
-
SPY
-
QQQ
-
GC
-
SI
-
GLD
-
NFLX
-
DRN
-
TLT
-
SMH
-
EMB
-

As I mentioned on my Twitter feed, some folks are going to get a little confused (and misled) by the NQ since there’s all this chatter about Netflix's plunge and yet the NQ is bright green (at least as of this writing). What they’re missing is that, in the few minutes between the close of the regular session and the close of the GLOBEX, the NQ went plunge-a-roony. When the new “day” began, everything is zeroed out, of course, and so the gain they see on the NQ is merely a fractional recapture of the loss it had earlier (tinted below in yellow).
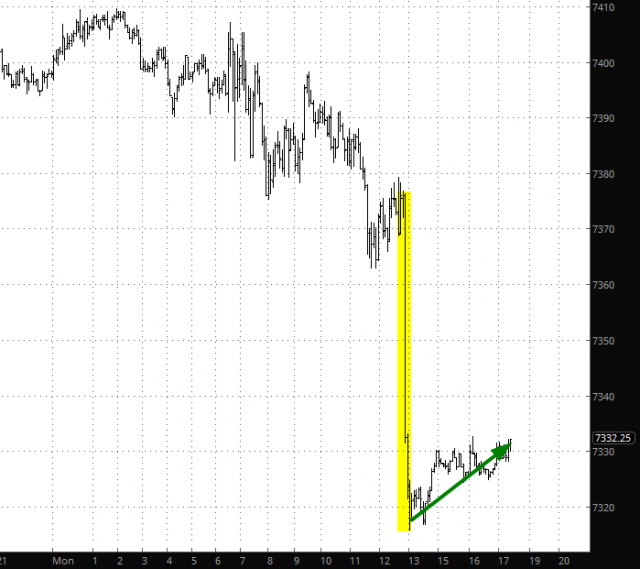
NQ Performance Chart

Anyway, let’s look at a few ETFs that I find interesting. First off is the triple-bullish-on-real-estate symbol DRN, which nailed the apex of it symmetric triangle and, since then, has been falling away from it. The drop isn’t big yet, but it’s a fascinating relationship prices have with those lines.
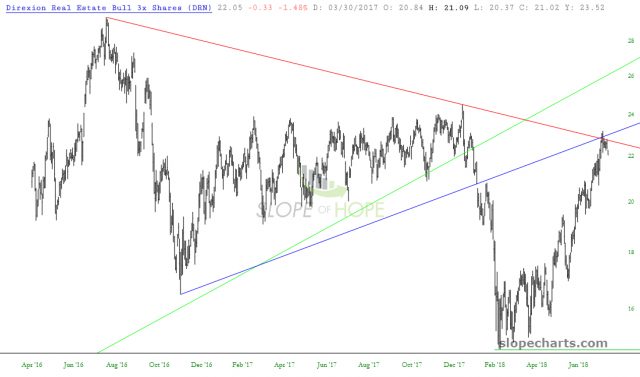
DRN Real Estate ETF Chart

The emerging markets bond fund (EMB) has turned away from its overhead supply. There isn’t really a pattern per se, but it is definitely moving down in “stair steps”, representing by progressively lower price ranges.
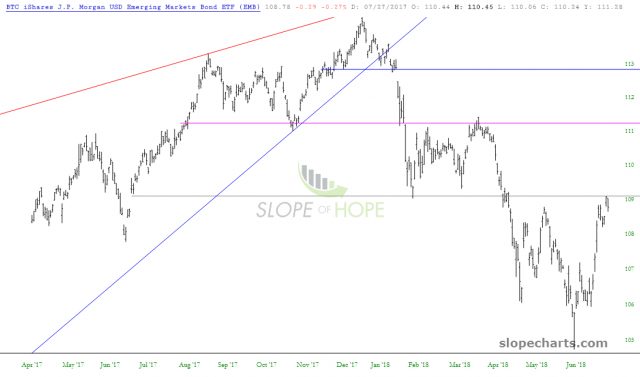
EMB ETF Performance Chart

Poor old precious metals are still awful, heading toward their 8th consecutive year of lower prices. Both silver and gold, the latter of which (GLD ETF) is shown below, continue to leak out value.
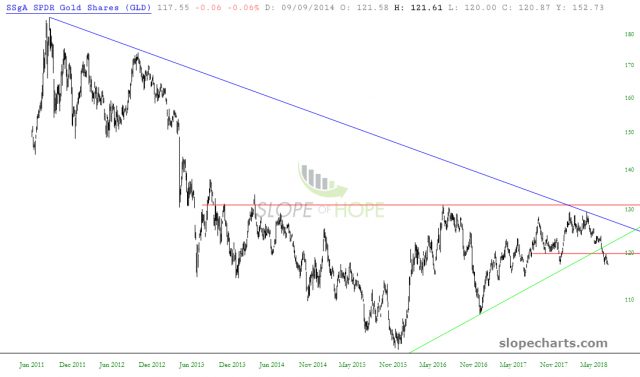
GLD ETF Performance Chart

The semiconductor sector, represented by SMH, has a gap (which is the anchor point of that horizontal line). It will be interesting to see when the likes of Intel (NASDAQ:INTC) report whether we fall away from that gap or recapture it. I’m not confident enough in either direction to take a position on this one.
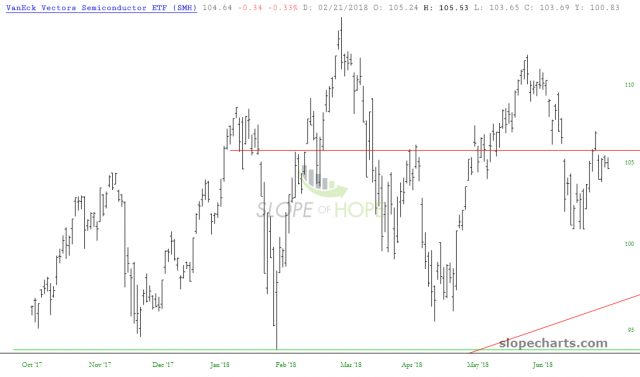
SMH ETF Performance Chart

The biggest boy of them all, SPY, already broke above a bullish pattern (purple line), but I’ve put a somewhat higher line above it, just as a marker for its recent high. But, to be clear, the SPY has indeed broken above its base.
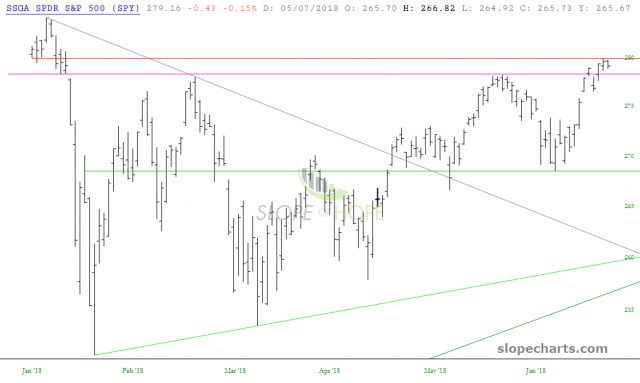
SPY ETF Performance Chart

The bond market (TLT) has started edging away from its own price gap. As low as we stay below the small horizontal I’ve drawn, this major topping pattern remains intact.
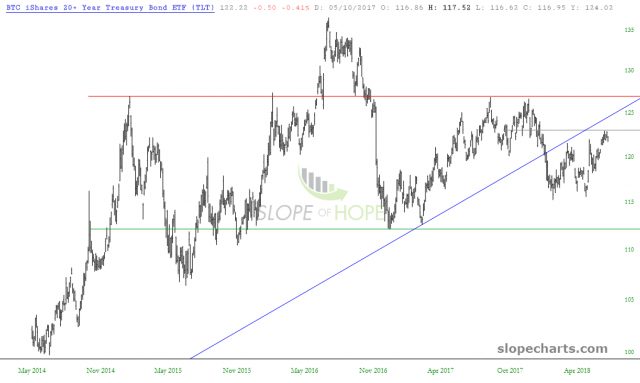
TLT ETF Performance Chart

Lastly is the QQQ, which should have an interesting day on Tuesday thanks for NFLX. This, too, is rather sloppy, as it has been meandering for the entire year in a lazy ascending channel. The CCI suggests it may be time for a downturn, even if the bullish formation isn’t broken.
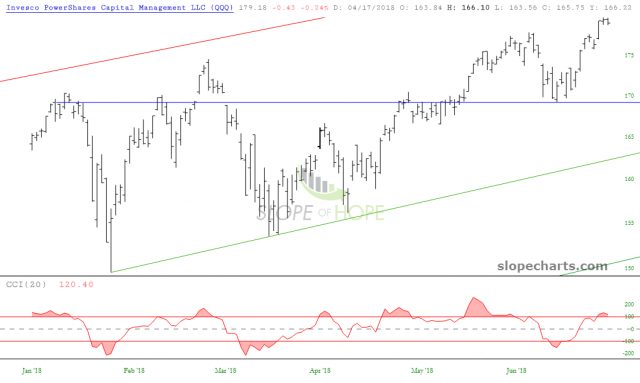
QQQ ETF Performance Chart

Latest comments

Loading next article…
Risk Disclosure: Trading in financial instruments and/or cryptocurrencies involves high risks including the risk of losing some, or all, of your investment amount, and may not be suitable for all investors. Prices of cryptocurrencies are extremely volatile and may be affected by external factors such as financial, regulatory or political events. Trading on margin increases the financial risks.
Before deciding to trade in financial instrument or cryptocurrencies you should be fully informed of the risks and costs associated with trading the financial markets, carefully consider your investment objectives, level of experience, and risk appetite, and seek professional advice where needed.
Fusion Media would like to remind you that the data contained in this website is not necessarily real-time nor accurate. The data and prices on the website are not necessarily provided by any market or exchange, but may be provided by market makers, and so prices may not be accurate and may differ from the actual price at any given market, meaning prices are indicative and not appropriate for trading purposes. Fusion Media and any provider of the data contained in this website will not accept liability for any loss or damage as a result of your trading, or your reliance on the information contained within this website.
It is prohibited to use, store, reproduce, display, modify, transmit or distribute the data contained in this website without the explicit prior written permission of Fusion Media and/or the data provider. All intellectual property rights are reserved by the providers and/or the exchange providing the data contained in this website.
Fusion Media may be compensated by the advertisers that appear on the website, based on your interaction with the advertisements or advertisers.
© 2007-2024 - Fusion Media Limited. All Rights Reserved.