According to a report by Yahoo, Verizon Communications Inc (NYSE:VZ) stock is the worst performer among the 30 stocks within the Dow Jones Industrial Average so far in 2017, after the share price of the telecom giant is down by over 18.5% this year. And indeed, Verizon finished 2016 close to $53.40 a share. Last week, it fell to as ow as $43.21.
And while there might have been plenty of fundamental reasons for VZ’s fall, such as its over-leveraged balance sheet or high price to earnings ratio, hardly anyone expressed any concerns while the stock was still trading above $50. We did.
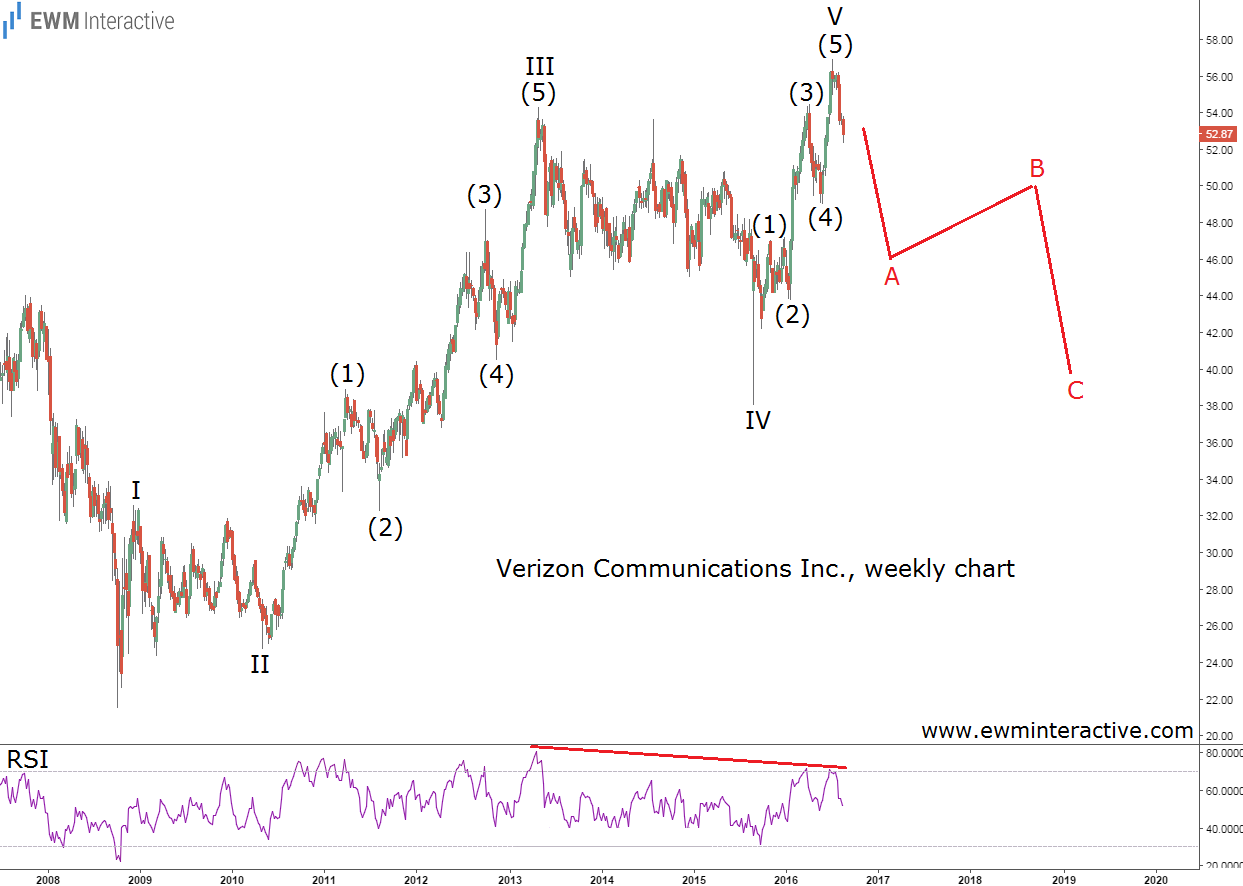
Back in August, 2016, while the stock price was slightly below $53, we published “Verizon Has a Bright Future, But…”, where the following chart was included.

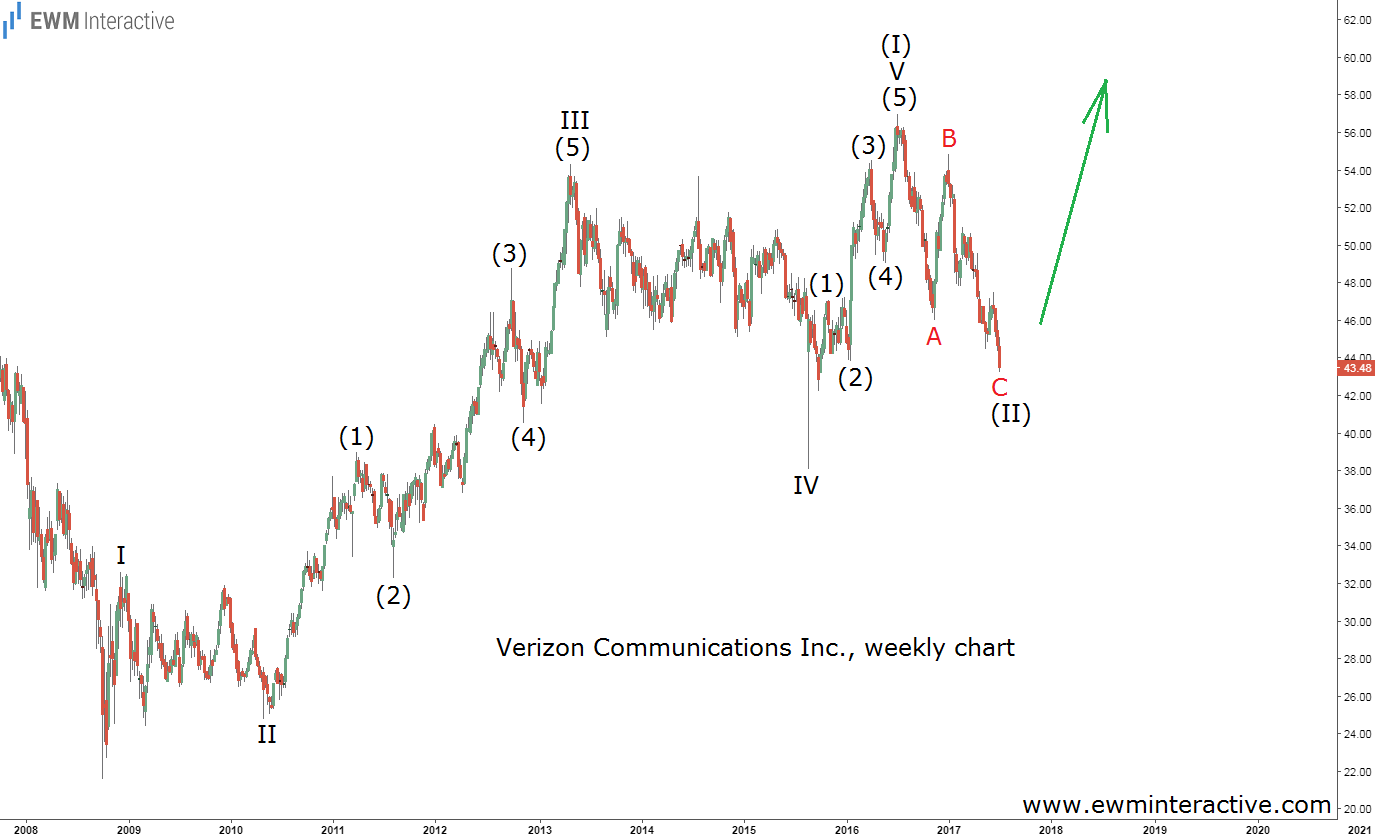
Almost a year ago, the weekly price chart of Verizon stock allowed us to recognize a complete five-wave impulse up from the bottom in 2008. According to the Elliott Wave Principle, a three-wave correction in the other direction follows every impulse. In addition, there was a bearish RSI divergence between waves III and V. So, instead of joining the bulls near $53 a share, we thought investors should be careful, because the stock was on the verge of a significant pullback, probably down to the support area of wave IV. It is July, 2017 now, and this is an updated chart of Verizon Communications Inc (NYSE:VZ).

It is true that the plunge between $56.95 and $43.21 already has a three-wave structure, which in theory means the 5-3 wave cycle is complete and the uptrend should be expected to resume. But it is also true that the current decline is quite small relative to the preceding impulse. Therefore, we believe one of the following scenarios is more likely.

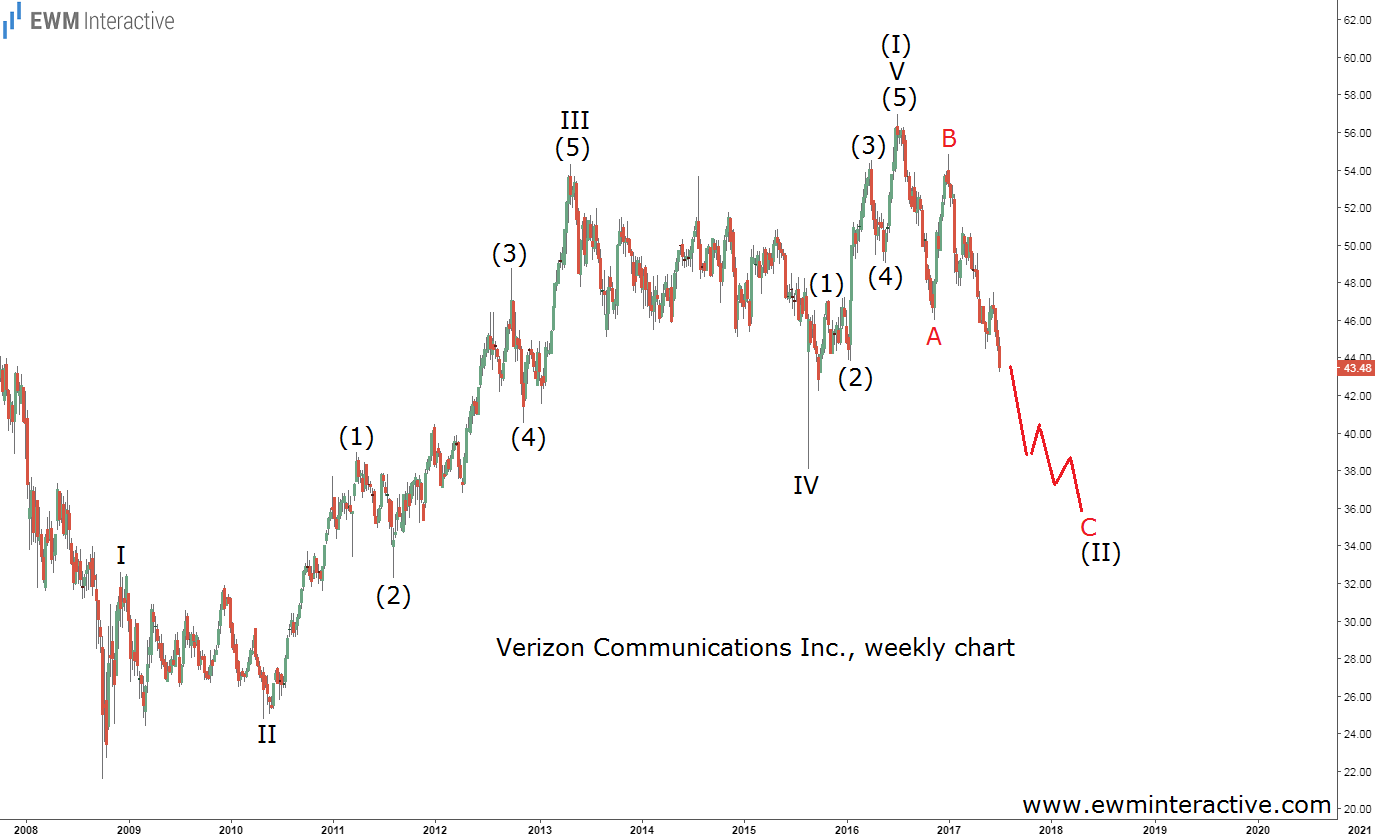
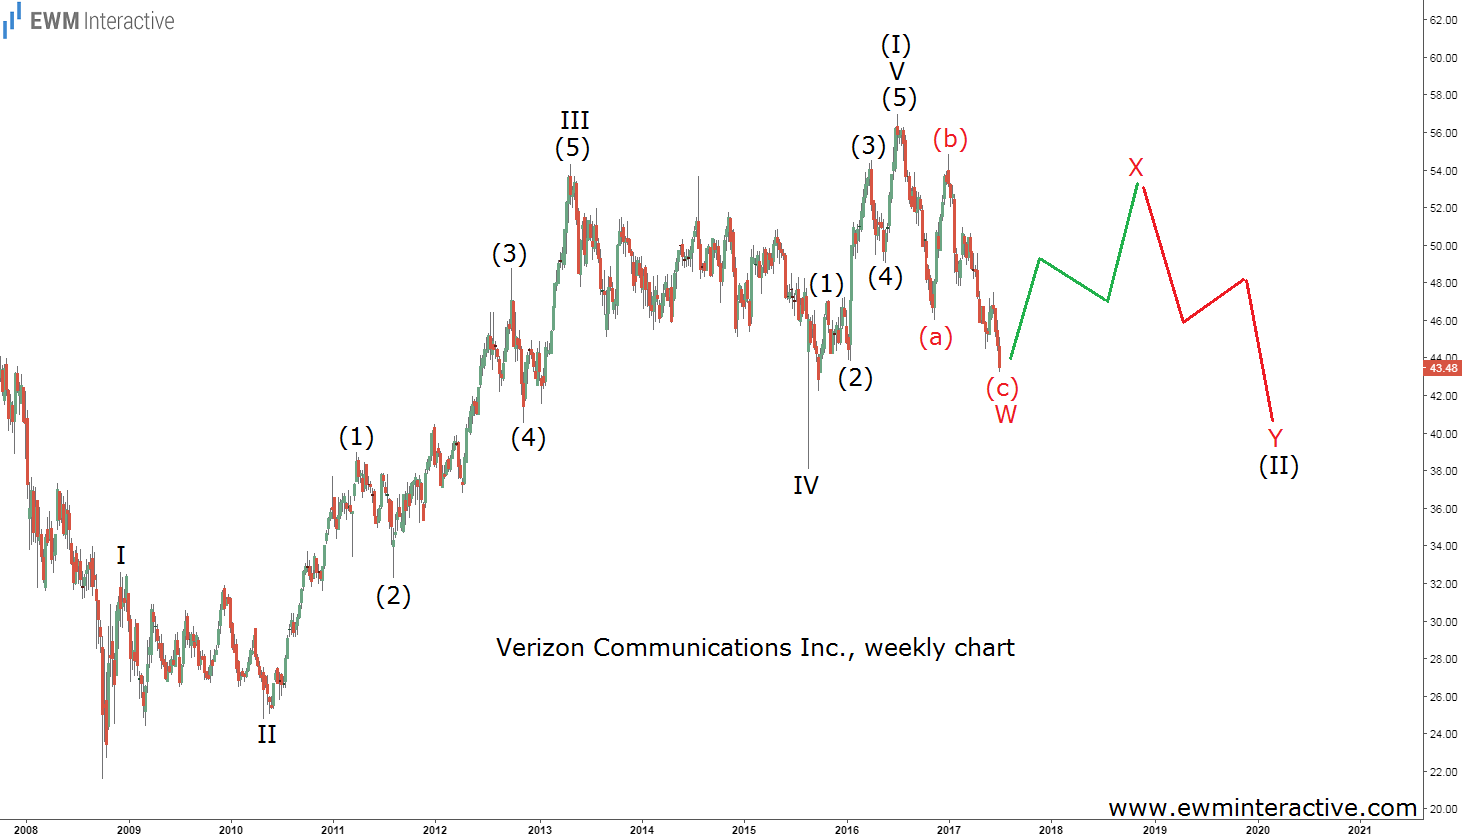
The first alternative suggests that wave C of (II) is not over just yet and should extend further to the downside until reaching the mid-$30s. The other equally probable count suggests that Verizon’s correction could extend more in terms of time than in terms of price, as shown below.

If the market chooses this count, wave (II) could evolve into a more complex W-X-Y double zig-zag correction from now on. Then, the recent three-wave slump would turn out to be just the first phase – wave W – which should be followed by a three-wave recovery in wave X and then another three-wave decline in wave Y. To be honest, we like this count most, because it includes the time factor into the picture. Time will tell which one the market is going to pick, but chances are Verizon’s troubles are not over yet.
