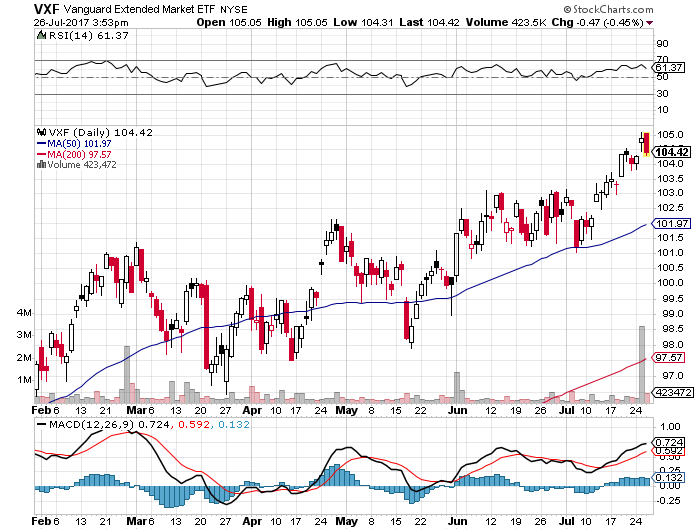
We have seen some good sized inflows into Vanguard Extended Market (NYSE:VXF) (Expense Ratio 0.08%, $5.8 billion in AUM), which falls within the “Multi-Cap” space as one might surmise given the fund’s title.
Like many Vanguard ETFs, VXF has its roots in a mutual fund strategy, ticker VEXMX (Vanguard Extended Market Index Fund, Expense Ratio 0.21%, $57.2 billion in AUM) that launched way back in late December of 1987. During Vanguard’s foray into the ETF business, Vanguard debuted VXF into the marketplace years later in late December of 2001 hoping to mimic the asset gathering success of the mutual fund.
At the moment we see that VXF, thanks to the recent inflows topping $750 million, ranks fifth in the greater “Mid-Cap Blend Equity” behind larger funds like IJH (iShares Core S&P Mid-Cap, Expense Ratio 0.07%, $40.4 billion in AUM), NYSE:VO (Vanguard Mid-Cap, Expense Ratio 0.06%, $20 billion in AUM), NYSE:MDY (SPDR S&P Midcap 400, Expense Ratio 0.25%, $19 billion in AUM), and NYSE:IWR (iShares Russell Mid-Cap, Expense Ratio 0.20%, $15.7 billion in AUM).
Based on the “S&P Completion Index,” which is likely not a familiar index to most, fund literature suggests the following about VXF: “Seeks to track the performance of a benchmark index that measures the investment return of stocks from small and midsize companies.” Furthermore, and in a point that illustrates exactly where the value of the S&P Completion Index may lay in the context of overall index investing, “Provides a convenient way to match the performance of virtually all regularly traded U.S. stocks except those in the S&P 500 Index.” This is an important point in that S&P and Vanguard are isolating “regularly traded stocks” as opposed to containing potentially illiquid names, but ones that are not S&P 500 names.
When we look at the top holdings within VXF the previous statements jump out at us loud and clear in illustrating how VXF is structured: 1) Tesla Inc (NASDAQ:TSLA) (0.88%), 2) Liberty Global PLC (NASDAQ:LBTYA) (0.61%), 3) Las Vegas Sands Corp (NYSE:LVS) (0.48%) 4) T-Mobile US Inc (NASDAQ:TMUS) (0.44%), 5) ServiceNow Inc (NYSE:NOW) (0.37%), 6) SBA Communications Corp (NASDAQ:SBAC) (0.37%), 7) Biomarin Pharmaceutical Inc (NASDAQ:BMRN) (0.35%), 8) MGM Resorts International (NYSE:MGM) (0.35%), 9) IHS Markit Ltd (NASDAQ:INFO) (0.35%), and 10) First Republic Bank (NYSE:FRC) (0.32%).

The Vanguard Extended Market ETF (NYSE:VXF) was trading at $104.41 per share on Wednesday afternoon, down $0.48 (-0.46%). Year-to-date, VXF has gained 9.50%, versus a 11.72% rise in the benchmark S&P 500 index during the same period.
VXF currently has an ETF Daily News SMART Grade of A (Strong Buy), and is ranked #5 of 29 ETFs in the Mid Cap Blend ETFs category.
