ValuEngine tracks more than 7000 U.S. equities, ADRs, and foreign stock which trade on U.S. exchanges as well as 1000 Canadian equities. When EPS estimates are available for a given equity, our model calculates a level of mispricing or valuation percentage for that equity based on earnings estimates and what the stock should be worth if the market were totally rational and efficient — an academic exercise to be sure, but one which allows for useful comparisons between equities, sectors, and industries. Using our Valuation Model, we can currently assign a VE valuation calculation to more than 2800 stocks in our U.S. universe.
We combine all of the equities with a valuation calculation to track market valuation figures and use them as a metric for making calls about the overall state of the market. Two factors can lower these figures — a market pullback, or a significant rise in EPS estimates. Vice-versa, a significant rally or reduction in EPS can raise the figure. Whenever we see overvaluation levels in excess of 65% for the overall universe and/or 27% for the overvalued by 20% or more categories, we issue a valuation warning.
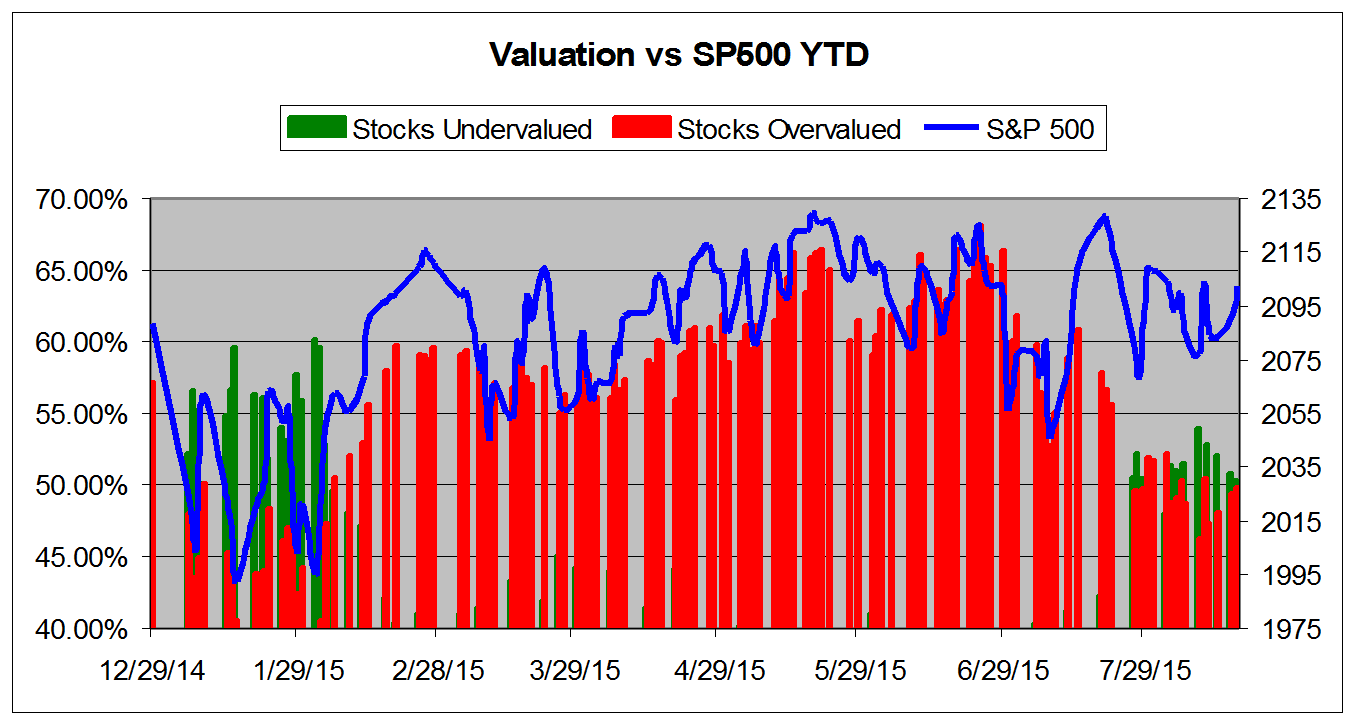
We now calculate that 49.77% of stocks are overvalued and 17.67% of those stocks are overvalued by 20% or more. These figures have been decreasing over the summer as the market has been volatile and subjected to some battering from events in the Eurozone, Greece, and now China. We have also seen a big hit for oil prices and Apple shares (NASDAQ:AAPL) (whose stock price can have a disproportionate effect on key indices.)
We did our last valuation study on June 25th, and with many stocks putting in some of that "Sell In May and Go Away" price action, valuation levels have declined significantly from levels in excess of 68% or so on June 24th to the current "normal" range of 50%. We saw figures as low as 46% earlier this month, and you would have to go all the way back to early February — with the S&P 500 trading at 2020 — to find stocks that cheap.
As always, the key part of the puzzle for U.S. equity prices remains the Fed and how they will end the era of quantitative easing. "September" has been the response for quite some time now, but events keep interfering with the best efforts of U.S. central bankers to get back to a normal interest rate environment.
China's long-demanded (be careful what you wish for!) currency devaluation and their market pull back has sent shock waves throughout the global financial system. This hurts stock prices in the U.S., but — paradoxically — it helps bolster than too as it becomes difficult to imagine the Fed making any move higher rates in a period of global uncertainty.
Meanwhile, the domestic economic picture remains solid. Good news on the employment front, some indication of wage pressures, signs of a pop in housing, lower oil prices, and now, the possibility of cheaper Chinese goods thanks to the currency devaluation.
That should go a long way in assuaging fears of inflation on the part of the Fed and, again, lowers the possibility of some rapid rate-rise in the fall. As long as they fulfill their promise to pay attention to both sides of their mandate — manage inflation AND promote full employment — they should be able to keep their foot on the pedal for a while longer.
And again, U.S. equities remain standing as the last bastion of decent yield for scared investors the world over. As we have been saying for a while now, we remain confident that the underlying U.S. economy is strong and getting stronger. However, we live in an interconnected world and China has a cold. Therefore we remain convinced that the Fed will raise rates later rather than sooner, and U.S. stocks should benefit from this environment as long as the crises in other areas don't become unmanageable.
The chart below tracks the valuation metrics from January 2015. It shows levels in excess of 40%.

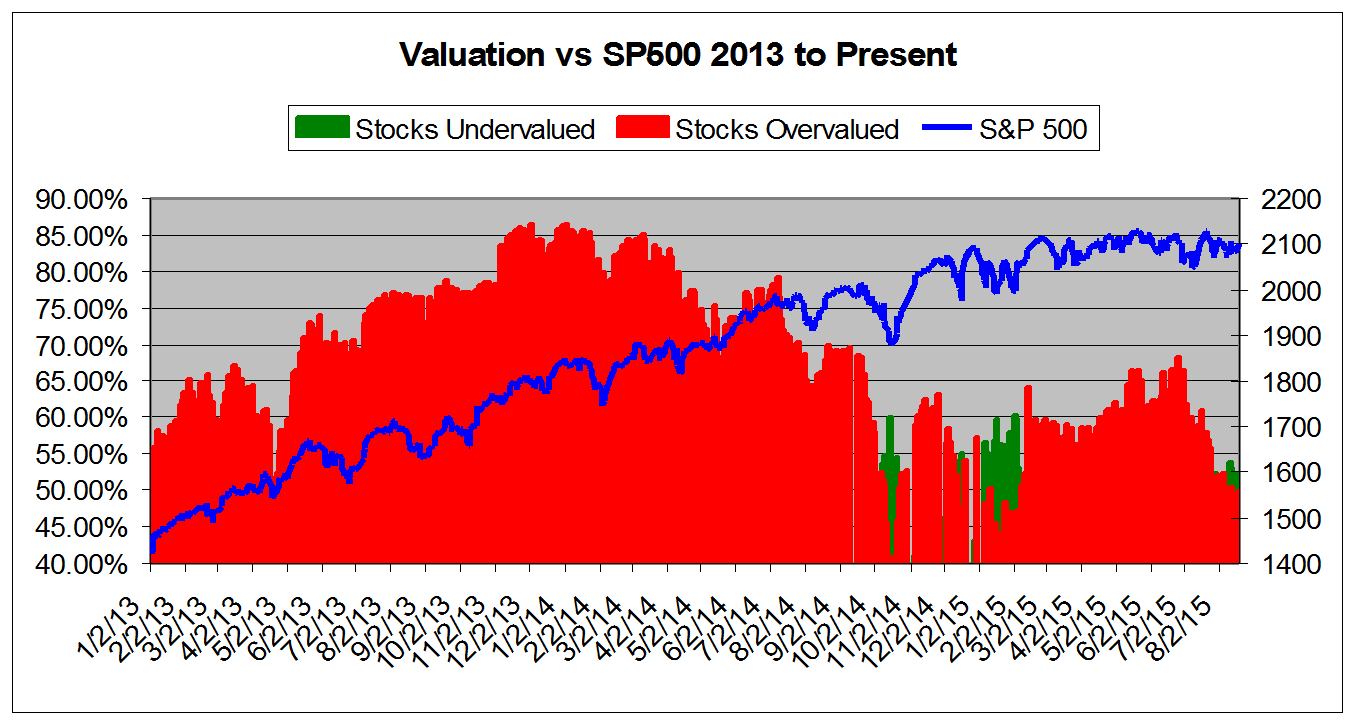
This chart shows overall universe over valuation in excess of 40% vs. the S&P 500 from January 2013. 
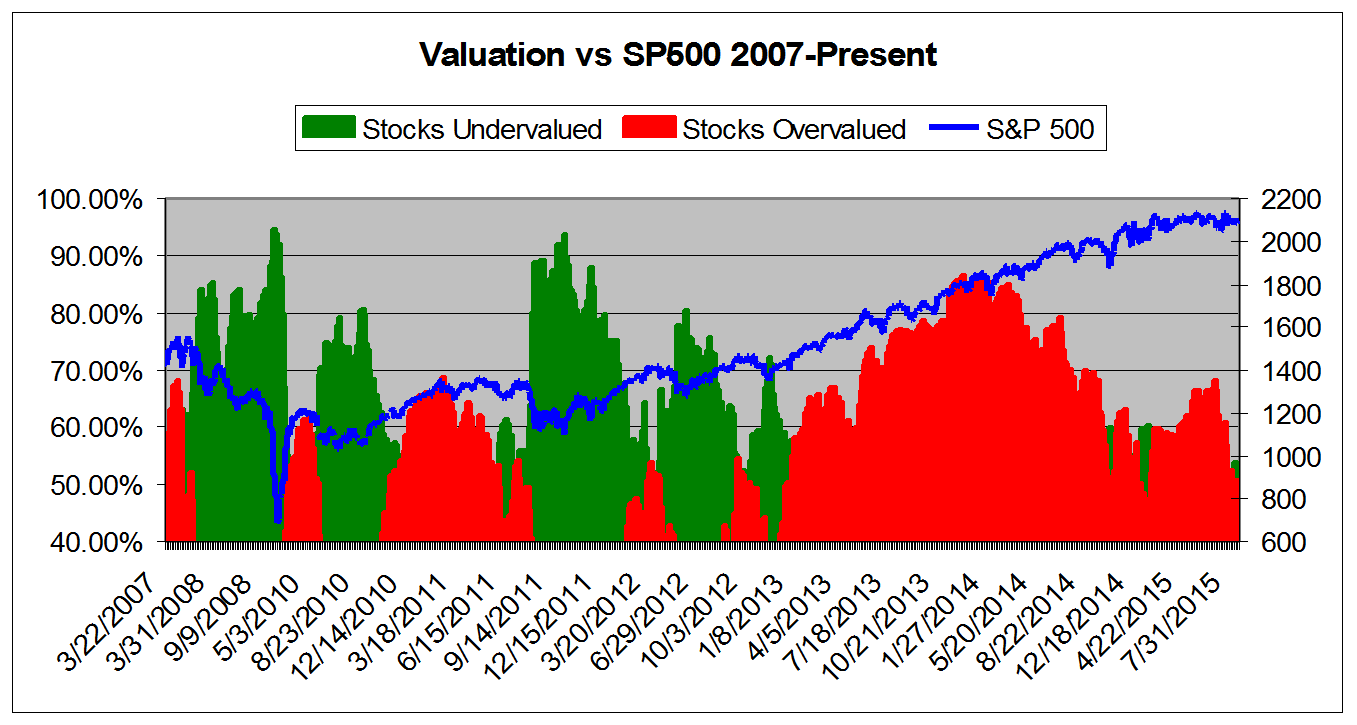
This chart shows overall universe under and over valuation in excess of 40% vs the S&P 500 from March 2007.* 
*Time Scale Compressed Prior to 2011.
