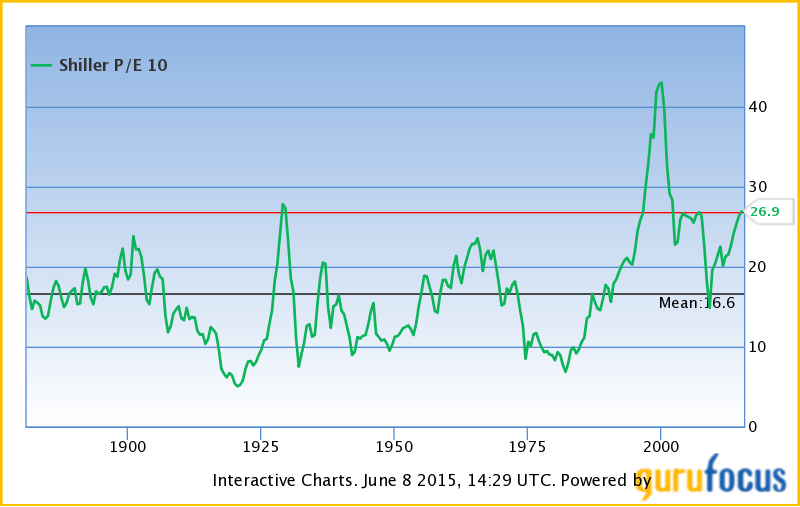
Last quarter, I wrote that US stocks were priced to deliver a negative 0.3% over the next eight years based on the cyclically-adjusted price/earnings ratio (“CAPE”). With another three months under our belts, it’s time for an update.

In March, the S&P 500 was trading at a CAPE of 27.0. Today, the number is essentially unchanged at 26.9%, and our expected annual return over the next eight years remains at -0.3%.
The past six months have seen flattish earnings growth and a stock market that has traded in a narrow trading range. So, it should really come as no surprise that the CAPE hasn’t budged much. But while this might seem like a lack of news, it actually gives us a great opportunity to pick apart this valuation metric for some insight.
Remember, all valuation metrics are relative. They compare a numerator – which is usually the current stock or index price – to a denominator. In the case of the CAPE, the denominator is an average of the past ten years’ worth of earnings. But you can just as easily use current-year earnings, cash flow, or sales.
The numerator – price – tends to move a lot faster than the denominator, so changes in valuation ratios tend to be driven by changing prices, though this is certainly not always the case. For example, a stock can get cheaper even if its share price remains unchanged if its earnings or sales are growing rapidly. This is why aggressive growth investors have no problem buying stocks at valuation multiples that might at first glance seem outrageous. If the underlying business is growing fast enough, a stock can grow into a nosebleed valuation.
On the flipside, seemingly cheap stocks can get vastly more expensive even with no movement in the share price if earnings or sales drop like a rock. This is what you call a value trap… and it’s what keeps value investors awake at night.
Let’s return now to the broader market. At a CAPE of 26.9, the S&P 500 is very expensive in historical terms. It’s not quite at “bubble” levels, as it was during the late 1990s. But it’s expensive nonetheless.
Could the market eventually grow into its multiple with several years of above-average earnings growth?
Well, I suppose anything is possible. But I think a more likely scenario is that corporate profits take a breather.
Starting at today’s levels, about the best that a buy-and-hold investor in an S&P 500 index fund can realistically expect over the next several years is a range-bound market.
