USD/JPY Can Buyers Take It Higher?
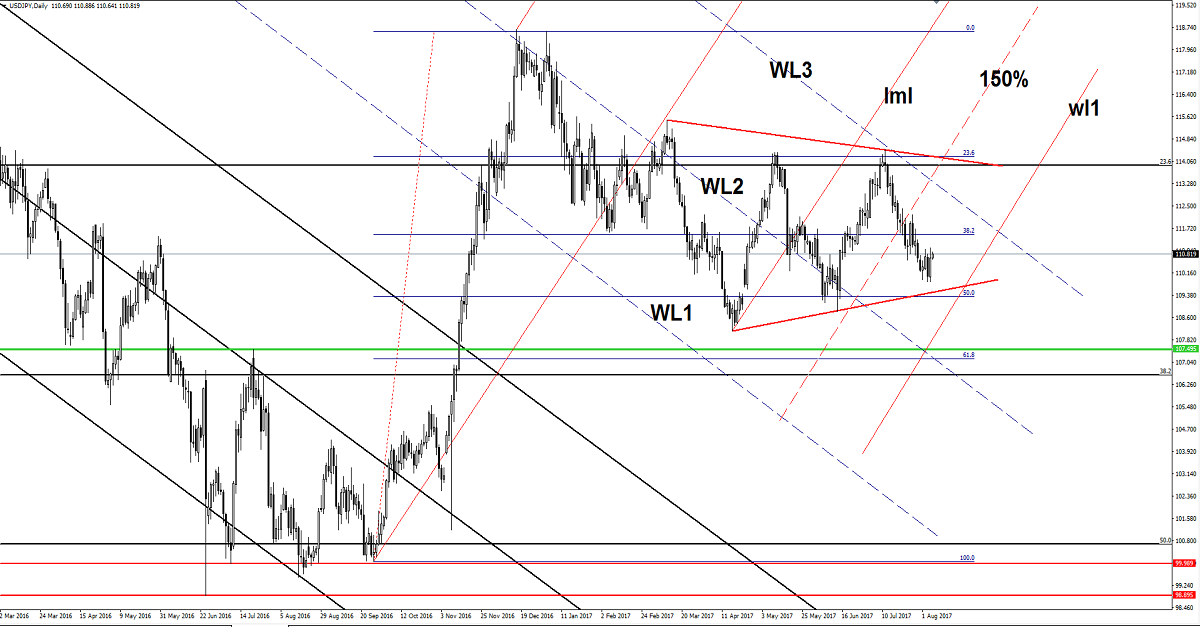
USD/JPY posted little gains today as the USDX and Nikkei have changed little as well. Price increased and is struggling to resume the Friday’s bullish candle. Is located above the 110.80 level and is approaching the 111.04 Friday’s high.
The Yen decreased as the Nikkei stock index is trading higher, the index retested the 20058 major static resistance today. JP225 continues to move sideways, is narrowing on the Daily chart, but I hope that we’ll have a clear and significant move very soon.
Nikkei has developed a minor symmetrical triangle, but remains to see the breakout direction because a drop towards the 19700 level will force the Yen to dominate the currency market again. The Japanese Leading Indicators indicator was reported at 106.3%, higher versus the 106.02%, but less versus the 104.6% in the former reading period.
Price increased and could reach and retest the 38.2% retracement level in the upcoming days if the USDX and the Nikkei stock index will increase. Continues to move in range between the 23.6% and the 50% retracement level, is trapped within a symmetrical triangle, so we’ll have a clear direction only after a valid breakout from the chart pattern.
USD/JPY failed to reach and retest the downside line of the symmetrical triangle, signaling that the bulls are sill in the game. A large rebound will be confirmed after a breakout above the WL3, while a broader drop under the warning line (wl1) of the minor ascending pitchfork.
USD/CAD Breakout Underway
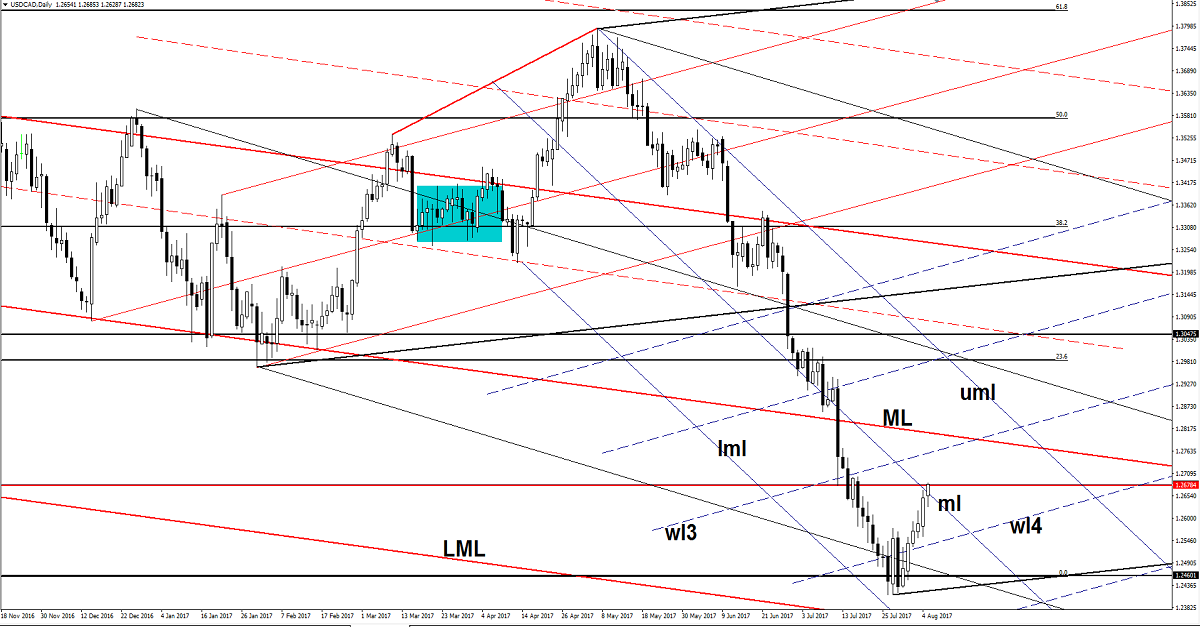
Price is trading in the green and looks motivated to take out the near term resistance levels. Has managed to jump above the median line (ml) of the minor descending pitchfork and now is pressuring the 1.2678 static support. A valid breakout above these levels will confirm a further increase in the upcoming days.
The next upside targets will be at the warning line (wl3) and higher at the median line (ML) of te major descending pitchfork. Could also be attracted by the upper median line (uml) of the minor descending pitchfork.
Brent Oil Should Hit New Lows
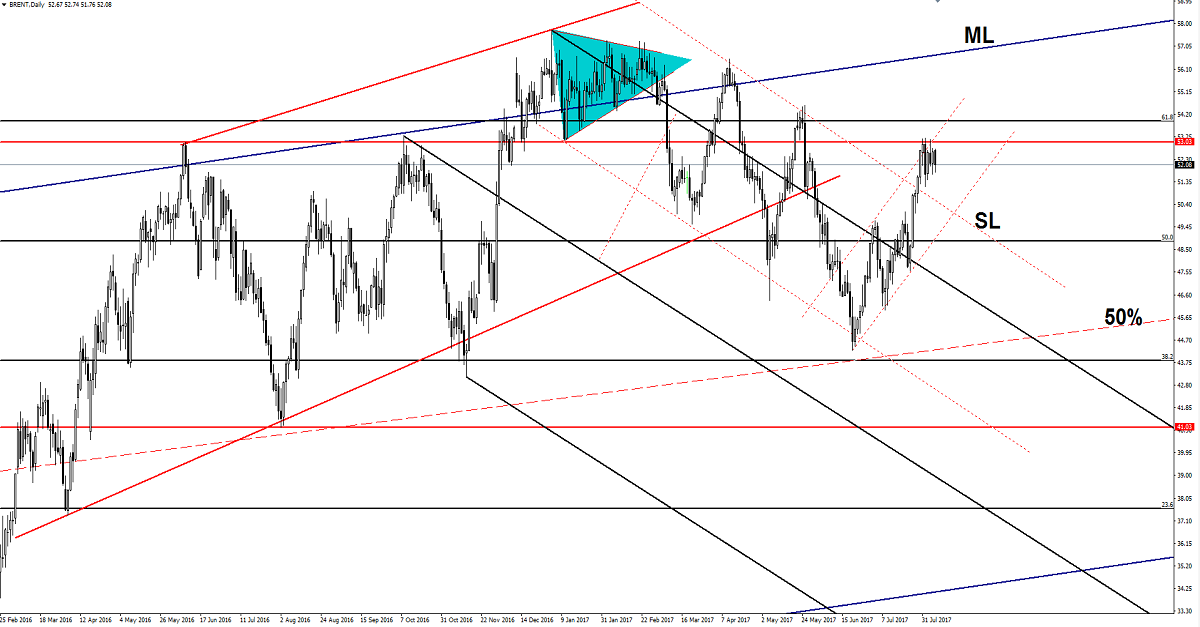
Brent is trading in the red after another failure to breakout above the 53.03 major static resistance. Is consolidating the latest gains, but he could decrease again in the upcoming days and could reach and retest the sliding line (SL) and the downside line of the minor ascending channel.
Risk Disclaimer: Trading in general is very risky and is not suited for everyone. There is always a chance of losing some or all of your initial investment/deposit, so do not invest money you can afford to lose. You are strongly advised to carry out your independent research before making any trading decisions. All the analysis, market reports posted on this site are only educational and do not constitute an investment advice or recommendation to open or close positions on international financial markets. The author is not responsible for any loss of profit or damage which may arise from transactions made based on any information on this web site.


