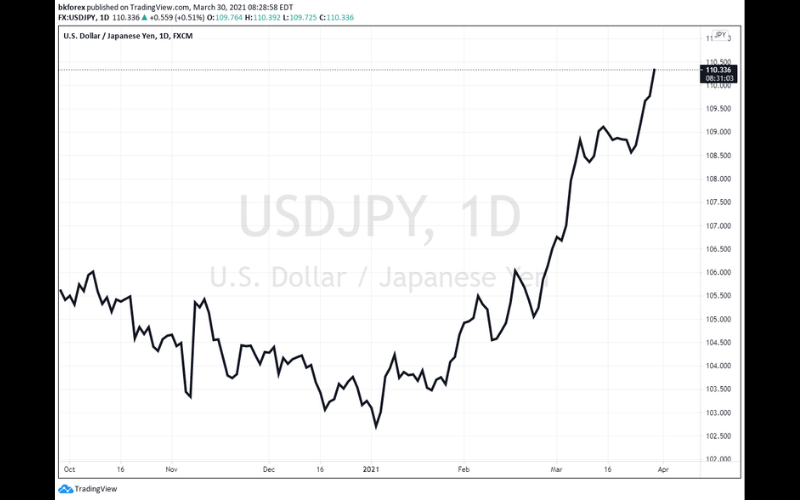
USD/JPY cleared the 110.00 figure for the first time in more than a year as US rates continued to climb.

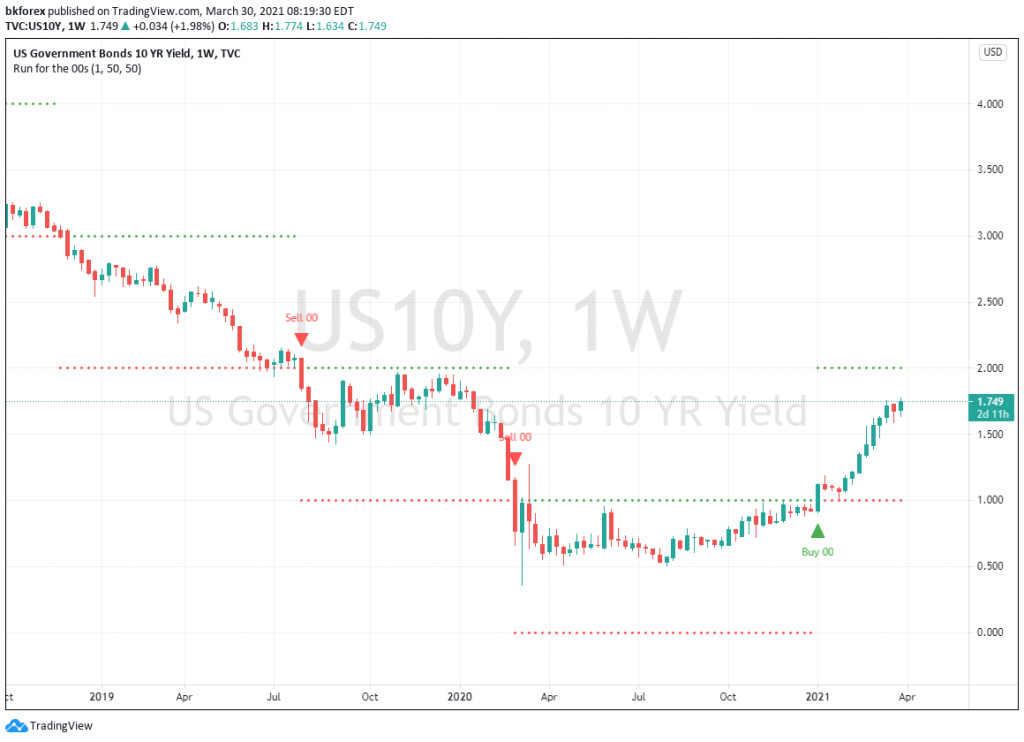
The benchmark 10-year yield reached 1.76% in overnight trade helping to fuel a board-based dollar rally with USD/JPY leading the way.
US Yields Drive the Story
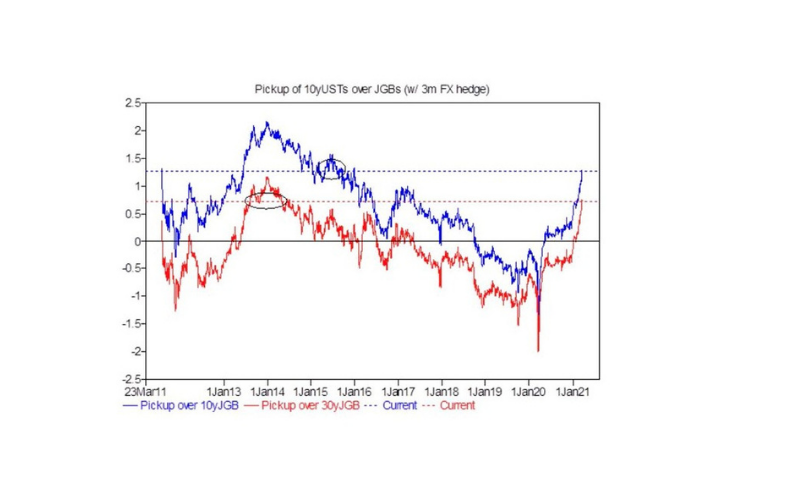
There is no doubt that US yields are driving the story in FX. As many analysts have pointed out on a real yield basis, US yields are now much more attractive than JGBs creating all of the flow into the pair.
In a yield starved world the pick up in US rates is a welcome sign for international investors who can enhance their return in the world’s most liquid fixed income market. As the chart below shows, the pick up in yield between the US Treasuries and Japanese Government Bonds has been rising for the past month and the trend shows no signs of slowing.
Fed Accommodation Spills Over Into FX
With the Fed controlling rates at the short end of the curve, US fixed income markets are starting to respond to the growing evidence of recovery by bidding up rates at the long end. The 10 year rate has risen 9 out the past 13 weeks since the start of the year increasing from 92 basis points to 176 basis points today. While the rise in rates has had a dampening effect on stocks—especially on the high P/E NASDAQ index—the most pronounced impact has been on currency, with the dollar rising markedly across the board.
The rise in the greenback is likely to have a mixed impact on global growth. Advanced economies that are US partners, such as, Germany and Japan, which have well developed export sectors, should see some benefit from the decline in the dollar.
The picture for emerging markets, however, is far less benign. Emerging market nations have to source inputs from oil to copper all priced in US dollars which is likely to increase their cost of living expenses.
More importantly, many EM nations issue dollar denominated debt which is far more difficult to service in a rising dollar environment. Countries with fragile finances are already in trouble as evidenced by the action in USD/TRY but others such as USD/RUB and USD/BRL have managed to remain relatively steady for now.
How Much Further Can it Go?

The big question for the market is how far can US yields extend? Barring any exogenous shock that would create a supply shortage, the market appears to have priced in much of the tightening due to a pick up in demand.
Looking at the 10-year chart we can see that the 200 basis point area is a major point of resistance and if yields quickly march to that level they will likely pause as investors assess just how much price pressures there are in the system.
With global capacity returning back on-line, many of the supply chain constraints that have plagued producers over the past three months should begin to ease and that in turn will have a moderating impact on prices. If that’s the scenario into the summertime, then US 10-year yields should begin to top out at 2% while USD/JPY will likely do the same at the 112.00 figure.
