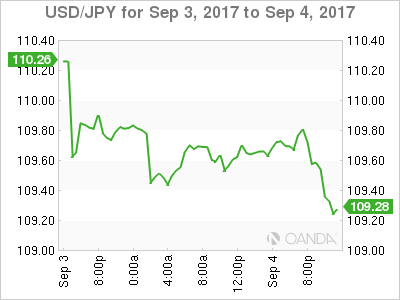
USD/JPY has posted considerable losses in the Monday session. In North American trade, the pair is trading at 109.61, down 0.58% on the day. On the release front, US banks are closed for the Labor Day holiday, so traders can expect a quiet North American session. In Japan, the sole event on the schedule is the 10-year bond auction.
The yen continues to show volatility due to the ongoing North Korean crisis, as the safe-haven asset has been in demand following hostile moves by North Korea. This was again the situation on Monday, as the yen improved following North Korea’s announcement that it had exploded a hydrogen bomb which could be fitted to an intercontinental ballistic missile. Although the claim has yet to be verified by Western analysts, it is clear that this nuclear device test has ratcheted tensions between North Korea and the US, Japan and South Korea. Predictably, US President Trump strongly condemned the North Korean action and has not ruled out a military response. The increased tensions have again shored up the yen, as risk appetite has waned. If the crisis in the Korean peninsula continues, traders can expect the Japanese currency to continue to gain ground.
US employment numbers were unexpectedly soft on Friday, but the dollar shrugged off the disappointing numbers and held its own against the yen. Nonfarm employment change slowed to 156 thousand, well below the estimate of 180 thousand. This marked a 3-month low. However, with the US labor market still close to capacity (the unemployment rate is just 4.4%), the markets can be forgiving about a softer nonfarm payroll report.
Wage growth, or the lack of it, is a more pressing concern. Average Hourly Earnings posted a small gain of 0.1%, missing the estimate of 0.2%. This was down from 0.3% in the previous report, and matched the weakest gain seen in 2017. The lack of wage gains has impacted on inflation levels, which remain well below the Fed’s inflation target of 2%. Soft inflation has dampened enthusiasm for a final rate hike in 2017, with the odds of December increase pegged at just 37%.
USD/JPY Fundamentals
Monday (September 4)
- 23:45 Japanese 10-y Bond Auction
*All release times are GMT
*Key events are in bold
USD/JPY for Monday, September 4, 2017

USD/JPY September 4 at 10:35 EDT
Open: 110.26 High: 110.26 Low: 109.38 Close: 109.61
USD/JPY Technical
| S3 | S2 | S1 | R1 | R2 | R3 |
| 106.28 | 107.49 | 108.69 | 110.10 | 110.94 | 112.57 |
USD/JPY edged higher in the Asian session but retracted in European trade. The pair is showing little movement in the North American session
- 108.69 is providing support
- 110.10 is the next resistance line
Current range: 110.10 to 110.94
Further levels in both directions:
- Below: 108.69, 107.49 and 106.28
- Above: 110.10, 110.94, 112.57 and 113.55
OANDA’s Open Positions Ratios
In the Monday session, the USD/JPY ratio is showing long positions have a majority (63%), indicative of trader bias towards USD/JPY reversing directions and moving lower.