The number of the day (and indeed the last two weeks) is 10.
As in, the price of a barrel of WTI crude oil declined for the 10th straight day on Friday – its longest streak since 1984. As my colleague Fawad Razaqzada noted earlier this week, the combination of slower growth in demand for oil and rising supply has created a textbook imbalance in the market, resulting in a 20% drop from last month’s peak price above 86.00 so far.
Of course, a massive move in such a fundamental commodity has implications beyond just the oil market. Predictably, energy stocks have been the worst-performing S&P 500 sector since early October, while consumer stocks have outperformed due to the big “tax cut at the pump.”
In the FX market, the Canadian dollar has been particularly hard hit by the collapse in the price of the country’s most important export, not to mention renewed worries about the language in the USMCA trade deal.
4-Month High
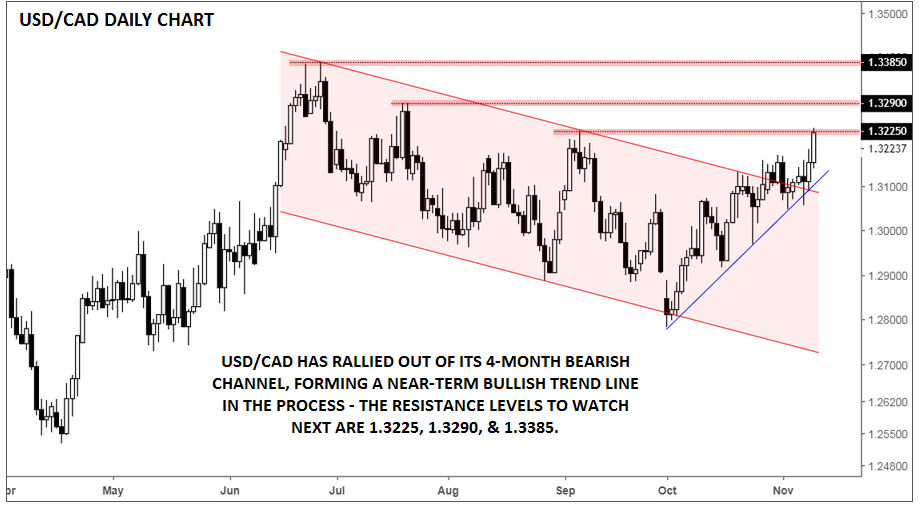
Technically speaking, USD/CAD bottomed the same week that oil prices peaked and the pair has since rallied up to test its highest level in nearly four months. Rates have now conclusively broken above their 4-month bearish channel, forming a near-term bullish trend line in the process.
As we went to press, the pair was testing the September high near 1.3225, but if that level breaks, a move up toward the July (1.3290) or June (1.3385) high could be next. On the other side of the coin, a recovery from oil's deeply oversold condition could lead to a bearish reversal in USD/CAD, with possible support emerging near last week’s high at 1.3170 or the bullish trend line around 1.3125.

Source: TradingView, FOREX.com
Cheers
