Market Brief
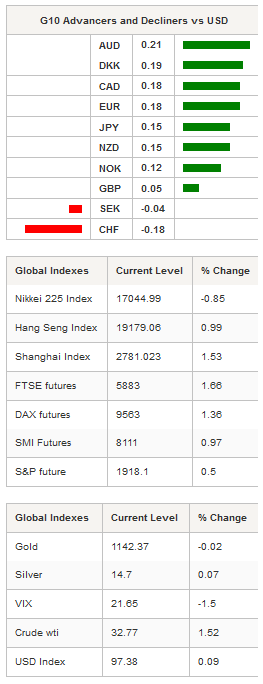
Global financial markets went for another rollercoaster ride on Wednesday as the US dollar got slammed across the board, helping crude oil to erase its losses from the previous two sessions. The combined effect of a sell-off in the greenback and a recovery in crude oil prices was beneficial for commodity currencies with the New Zealand dollar rallying the most against the USD. The Kiwi surged more than 2.80% yesterday, reaching $0.6698, but stumbled over the resistance implied by the high from January 8 at 0.6678. The Canadian dollar was the second best G10 performer with a climb of 2.20% against the greenback. USD/CAD moved below its 50dma (currently at 1.3923); on the downside a strong support can be found at 1.2832 (low from October 15). The Australian dollar climbed 2.10% to stabilise around $0.7170, while the Norwegian krone rose 2% against the USD as USD/NOK consolidated around 8.55.

A strong stomach was also needed to manage the sharp moves in the treasury market. The U.S. 2-Year treasury yield slid more than 8bps in less than two hours, reaching its lowest level since October 28 at 0.6750% as investors dumped equities to rush into safe haven assets. Finally, the monetary policy sensitive rate bounced back to 0.7265%, up 5bps. On the long-end, the 10-Year fell 10bps to 1.7920% before returning to its initial level at 1.8960%. The market is now roughly pricing no rate hike in 2016 as the US economy continues to post lacklustre data. US Markit PMIs disappointed with the Services and Composite gauge being revised lower to 53.2 from 53.7. Separately, ISM non-manufacturing slipped 2.3 points to 53.5, while the market was expecting a print of 55.1 in January.
With the exception of Japan, Asian regional equity markets are blinking green across the screens following Wall Street's positive lead. In mainland China the Shenzhen and Shanghai Composite were up 1.53% and 1.95% respectively. In Hong Kong the Hang Seng increased 0.99%, while in Australia shares were trading on a firmer footing, up 2.12%. European futures started the day on the right foot with the positive mood sweeping in from Asia. The FTSE 100 led the charge, up 1.66%, while the DAX jumped 1.36%. The SMI was up 0.97%, the CAC 40 1.23%, while the Euro Stoxx STOXX 600 surged 1.28%.
Just like most EM currencies, the BRL reacted more than positively to fading rate hike expectations in the US. The Brazilian real surged 2.40% against the greenback and moved below the 3.90 threshold.
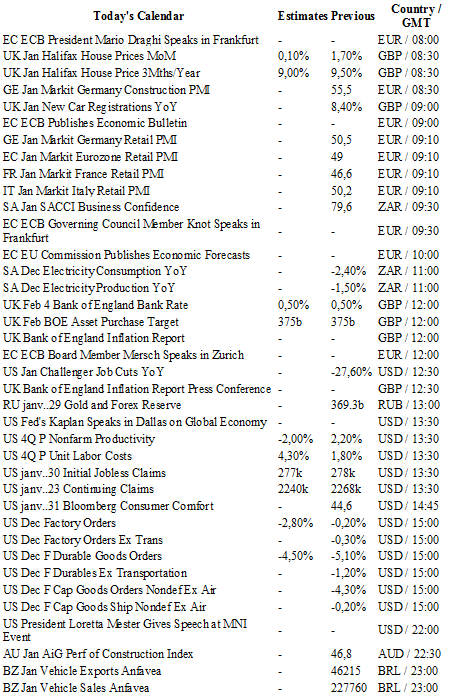
Today traders will be watching Halifax house price and BoE interest rate decision from the UK; Markit PMIs from Germany, France, Italy and the euro zone; initial jobless claims, factory orders and durable goods orders from the US.

Currency Tech
EUR/USD
R 2: 1.1495
R 1: 1.1387
CURRENT: 1.1126
S 1: 1.0711
S 2: 1.0524
GBP/USD
R 2: 1.5242
R 1: 1.4969
CURRENT: 1.4608
S 1: 1.3657
S 2: 1.3503
USD/JPY
R 2: 125.86
R 1: 123.76
CURRENT: 117.73
S 1: 115.57
S 2: 105.23
USD/CHF
R 2: 1.0676
R 1: 1.0328
CURRENT: 1.0061
S 1: 0.9786
S 2: 0.9476
