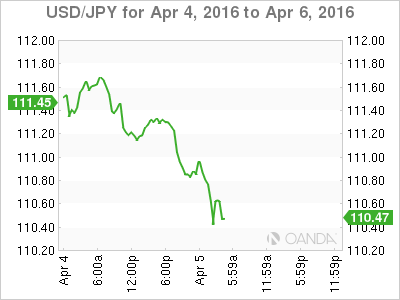
USD/JPY has posted considerable losses on Tuesday, continuing the downward movement which started the week. In the European session, the pair is trading at 110.40. On the release front, Japanese Average Cash Earnings was surprisingly strong, posting a gain of 0.9%. Yields on Japanese 10-year bonds fell into negative territory, coming in at -0.07%. In the US, it’s a busy day, with the release of ISM Non-Manufacturing PMI, Trade Balance and JOLTS Jobs Openings.
The yen continues to impress, and is trading at its highest level since October 2014. USD/JPY is down 100 points this week, following losses of close to 200 points last week. The Japanese currency improved on Tuesday after an excellent wage growth report. Average Cash Earnings climbed 0.9%, well above the estimate of 0.2%. This marked the strongest monthly gain in 10 months. Still, the BoJ remains under strong pressure to take action at its April meeting. The central bank adopted negative rates in January, and this was reflected in the April auction of 10-Year bonds, which posted a yield of -0.07%.
Last week’s US employment numbers were solid, pointing to a solid labor market. Nonfarm Payrolls came in at 215 thousand, above the estimate of 205 thousand. The unemployment rate edged up to 5.0%. However, wage growth remains weak, as Average Hourly Earnings posted a small gain of 0.3%, close to the estimate of 0.2%. The markets will be treated to more employment data on Tuesday, with the release of JOLTS Jobs Openings. The estimate for February stands at 5.57 million, which would be an improvement from the previous month’s reading of 5.54 million. Solid job numbers are critical to continued economic expansion and are a key factor in the Fed’s decision-making process regarding another rate hike.
USD/JPY Fundamentals
Monday (April 4)
- 20:00 Japanese Average Cash Earnings. Estimate 0.2%. Actual 0.9%
- 23:45 Japanese 10-year Bond Auction. Actual -0.07%
Tuesday (April 5)
- 8:30 US Trade Balance. Estimate -46.3B
- 9:45 US Final Services PMI. Estimate 51.0
- 10:00 US ISM Non-Manufacturing PMI. Estimate 54.1
- 10:00 US JOLTS Jobs Openings. Estimate 5.57M
- 10:00 US IBD/TIPP Economic Optimism. Estimate 47.7
Upcoming Key Events
Wednesday (April 6)
- 14:00 FOMC Meeting Minutes
*Key releases are highlighted in bold
*All release times are DST
USD/JPY for Tuesday, April 5, 2016

USD/JPY April 5 at 3:50 DST
Open: 111.22 Low: 110.27 High: 111.27 Close: 110.44
USD/JPY Technical
| S3 | S2 | S1 | R1 | R2 | R3 |
| 107.57 | 108.37 | 109.87 | 111.50 | 112.48 | 113.86 |
- USD/JPY has posted losses in the Asian and European sessions
- 109.87 is providing support.
- 111.50 has switched to resistance following strong gains by USD/JPY. It is a strong line
- Current range: 111.50 to 112.48
Further levels in both directions:
- Below: 109.87, 108.37 and 107.57
- Above: 111.50, 112.48, 113.86 and 114.65
OANDA’s Open Positions Ratio
USD/JPY ratio is showing little movement on Tuesday. Long positions command a strong majority (67%), indicative of strong trader bias towards the pair reversing directions and moving to higher levels.
