The ebbs and flows in the forex arena have resulted in the Japanese yen taking a step back late in the day, while the US dollar makes another one forward.
Quick Take
The ebbs and flows in the forex arena have resulted in the Japanese Yen taking a step back late in the day, while the US Dollar makes another one forward. A poor bid to cover in a 7y auction in US bonds managed to mitigate the prevailing risk-off flows, as it implies the bearish momentum in bond yields may be exhausting. Let's not forget, fixed income has been on the driving seat commanding what's ultimately permuted into broader risk-off dynamics as global growth expectations are dramatically readjusted amid the hostility in trade relationships between the US and China. The more risk assets sell, the more convinced the market is of a protracted trade war, that's the bottom line. The Aussie has been holding surprisingly steady even as the 10y Aus bond yield inverts against the official cash rate, implying next week's RBA rate cut is baked in the cake. Surprisingly, the Kiwi has detached from the valuation of the Aussie as the market turns more dovish on the RBNZ after an underwhelming BNZ business outlook report. Shifting gears to North America, I'd characterize the movements in the Canadian Dollar as 'uneventful' as the BOC kept the 'status quo', clearly aiming to sound non-committal as the US-China trade situation definitely justifies to stay cautious until further clarity. Lastly, the European currencies kept trading weak on the back of the EU election results.
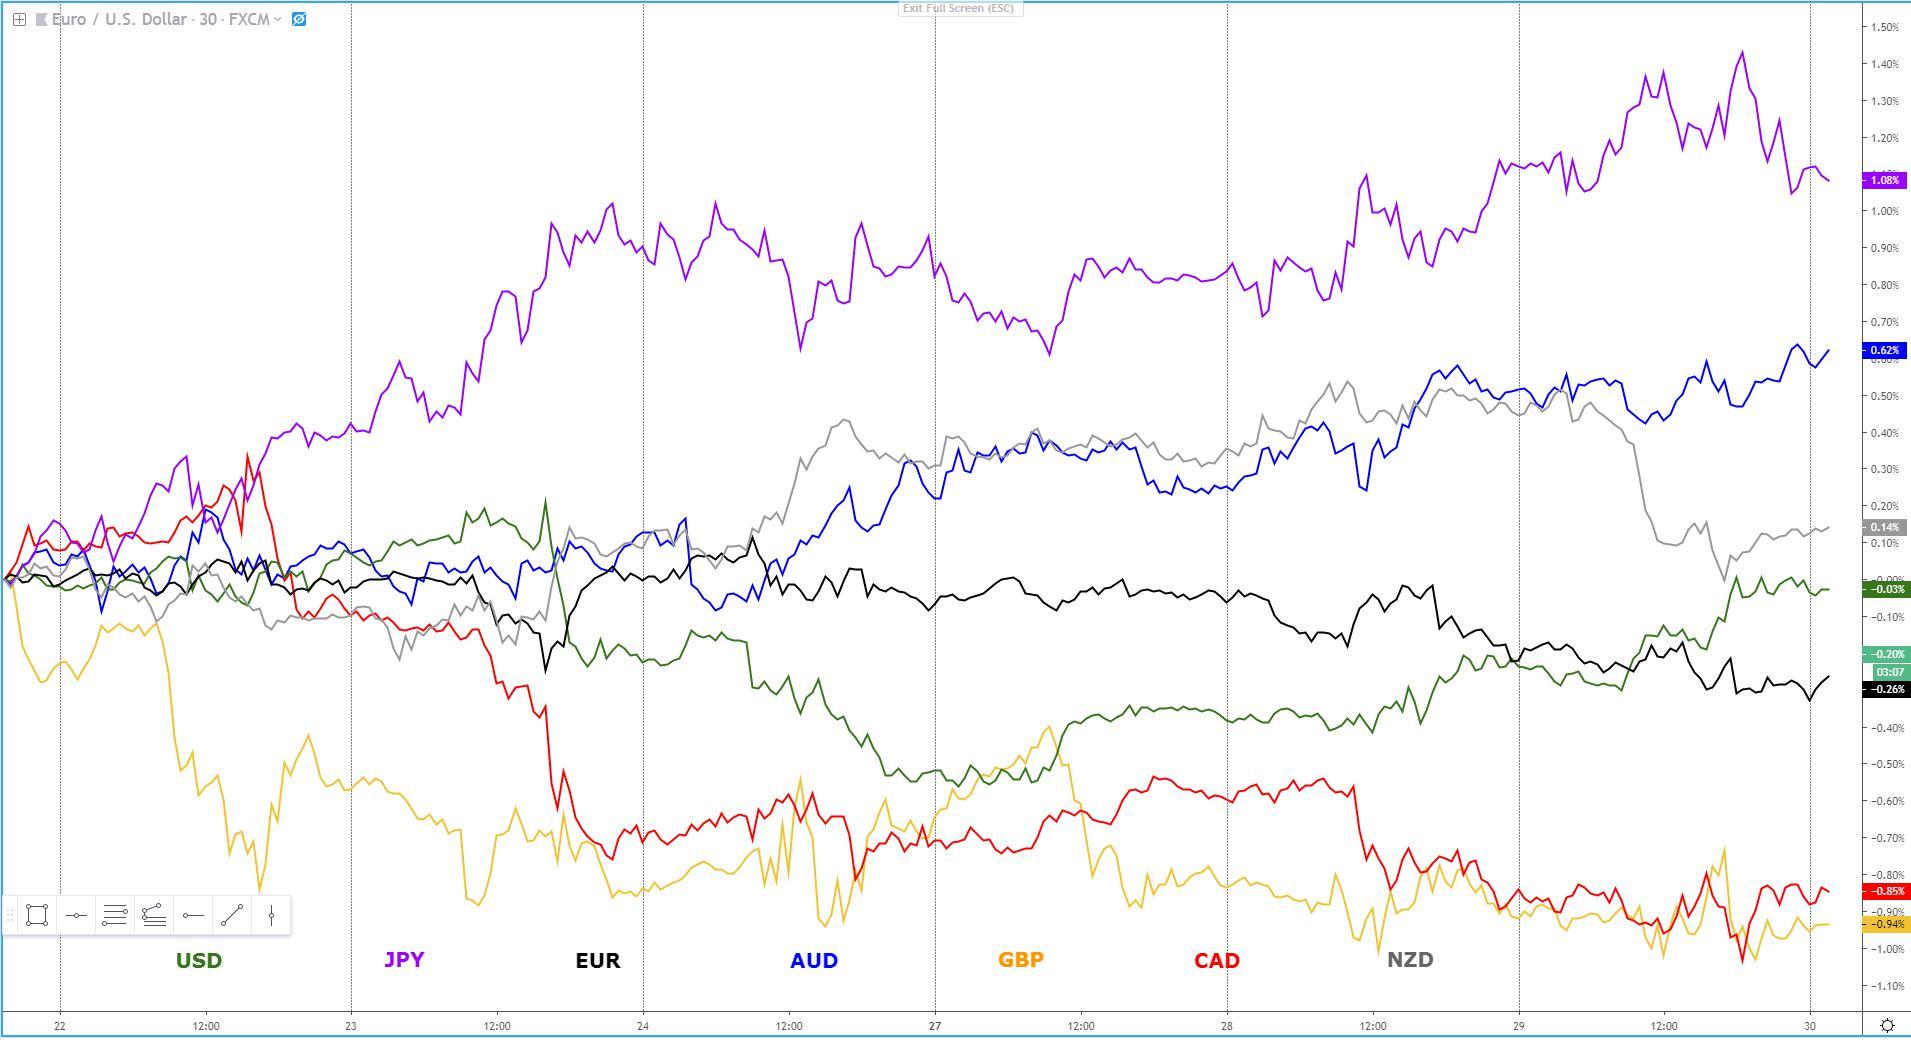
Narratives In Financial Markets
* The Information is gathered after scanning top publications including the FT, WSJ, Reuters, Bloomberg, ForexLive, Institutional Bank Research reports.
- Risk off flows continue unabated as the antagonized state in US-China trade relationships goes from bad to worse. The inaction from either side to abandon hard-line stances is feeding through the markets as the exasperation and realization of a protracted trade war settles in.
- It’s worth noting that Wednesday’s US treasury auction on $32b of 7-year notes was quite poor in terms of the bid to cover, which essentially translates in potential exhaustion of the prolonged rally in fixed income markets as valuations look quite stretched.
- The latest evidence that China is ready to strike back to the US trade hostility is a series of reports by reputable Chinese sources that suggest China mulls the possibility of cutting the supply of rare earth minerals to the US, with officials noting “don’t say we didn’t warn you.”
- The risk-off rally has favored the US Dollar, recovering most of its last week’s sharp losses as the pendulum continues to swing between negatives inputs on recent US fundamentals and positive flows as risk off warrants a bid in its safe-haven appeal.
- The market keeps pricing in a rate cut by the Federal Reserve, currently standing around 80% for the lowering of interest rates by September this year, with over 40bp of cuts priced in by year-end. These expectations imply the market envisions a slowdown in the US economy, as negative repercussions of prolonged trade strife with China are expected.
- Even more aggressive has been the pricing of rate cuts seen in Australia. If we take the 10y Australian government bond yield as the guidance, it implies a fully priced (100%) cut in rates next week. The 10y maturity has essentially inverted to the cash rate (1.48% vs 1.5%).
- The BoC keeps its ‘status quo’ in its policy decision by stating that the current rate of 1.75% is appropriate while projecting a rather benign outlook for growth heading into H2 ‘19 on the basis that economic data does not warrant to hold an equally pessimistic stance as compared to late 2018, early 2019. Nonetheless, the Central Bank recognized that the uncertainty surrounds the US-China tensions is likely to have negative ripple effects if persisting.
- US Special Counsel Mueller said that his investigation over the Russian muddling in the US election and the ties with the Trump campaign did not exonerate the US President in any capacity. Mueller also announced his official resignation and formally closed the office.
- The European Commission, according to Radiocor, has notified the Italian government that unless there is a credible justification to the intended adjustments in Italy’s debt to GDP, with the deadline this Friday, disciplinary measures (fine) may soon take effect. The EC vs Italy tense saga may cause further downside pressure in EUR supply flows.
Recent Economic Indicators And Events Ahead
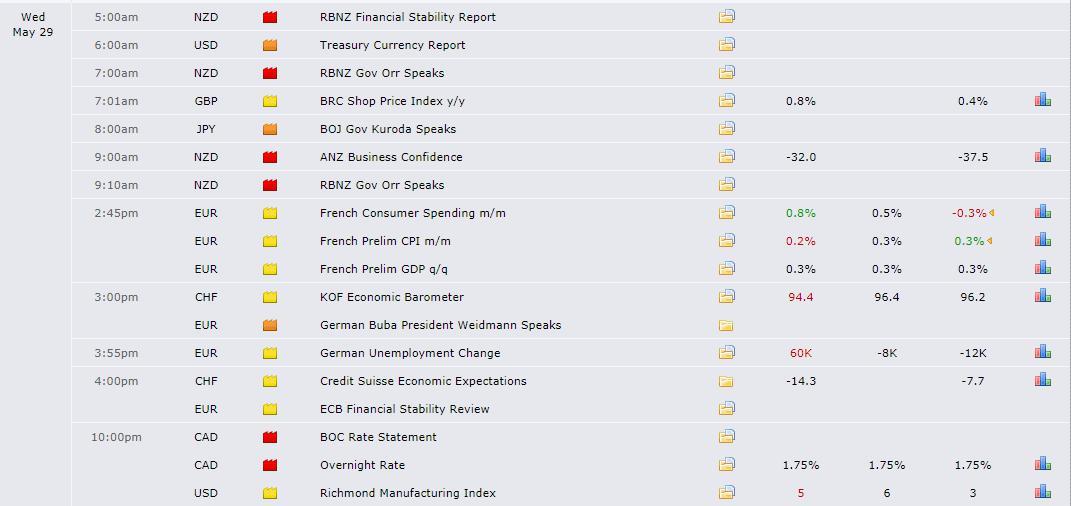
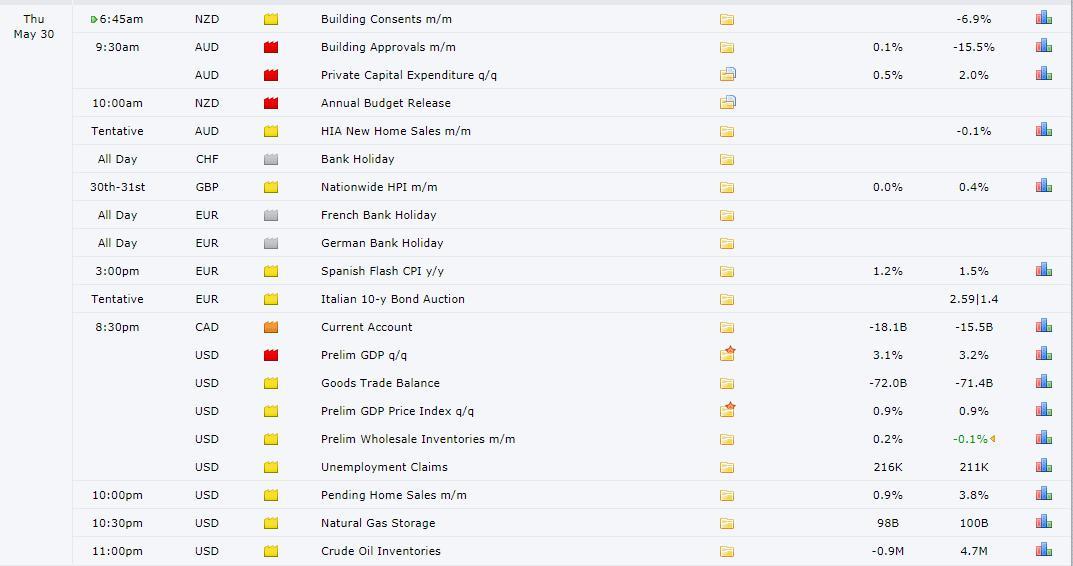
Source: Forexfactory
RORO (Risk On, Risk Off Conditions)
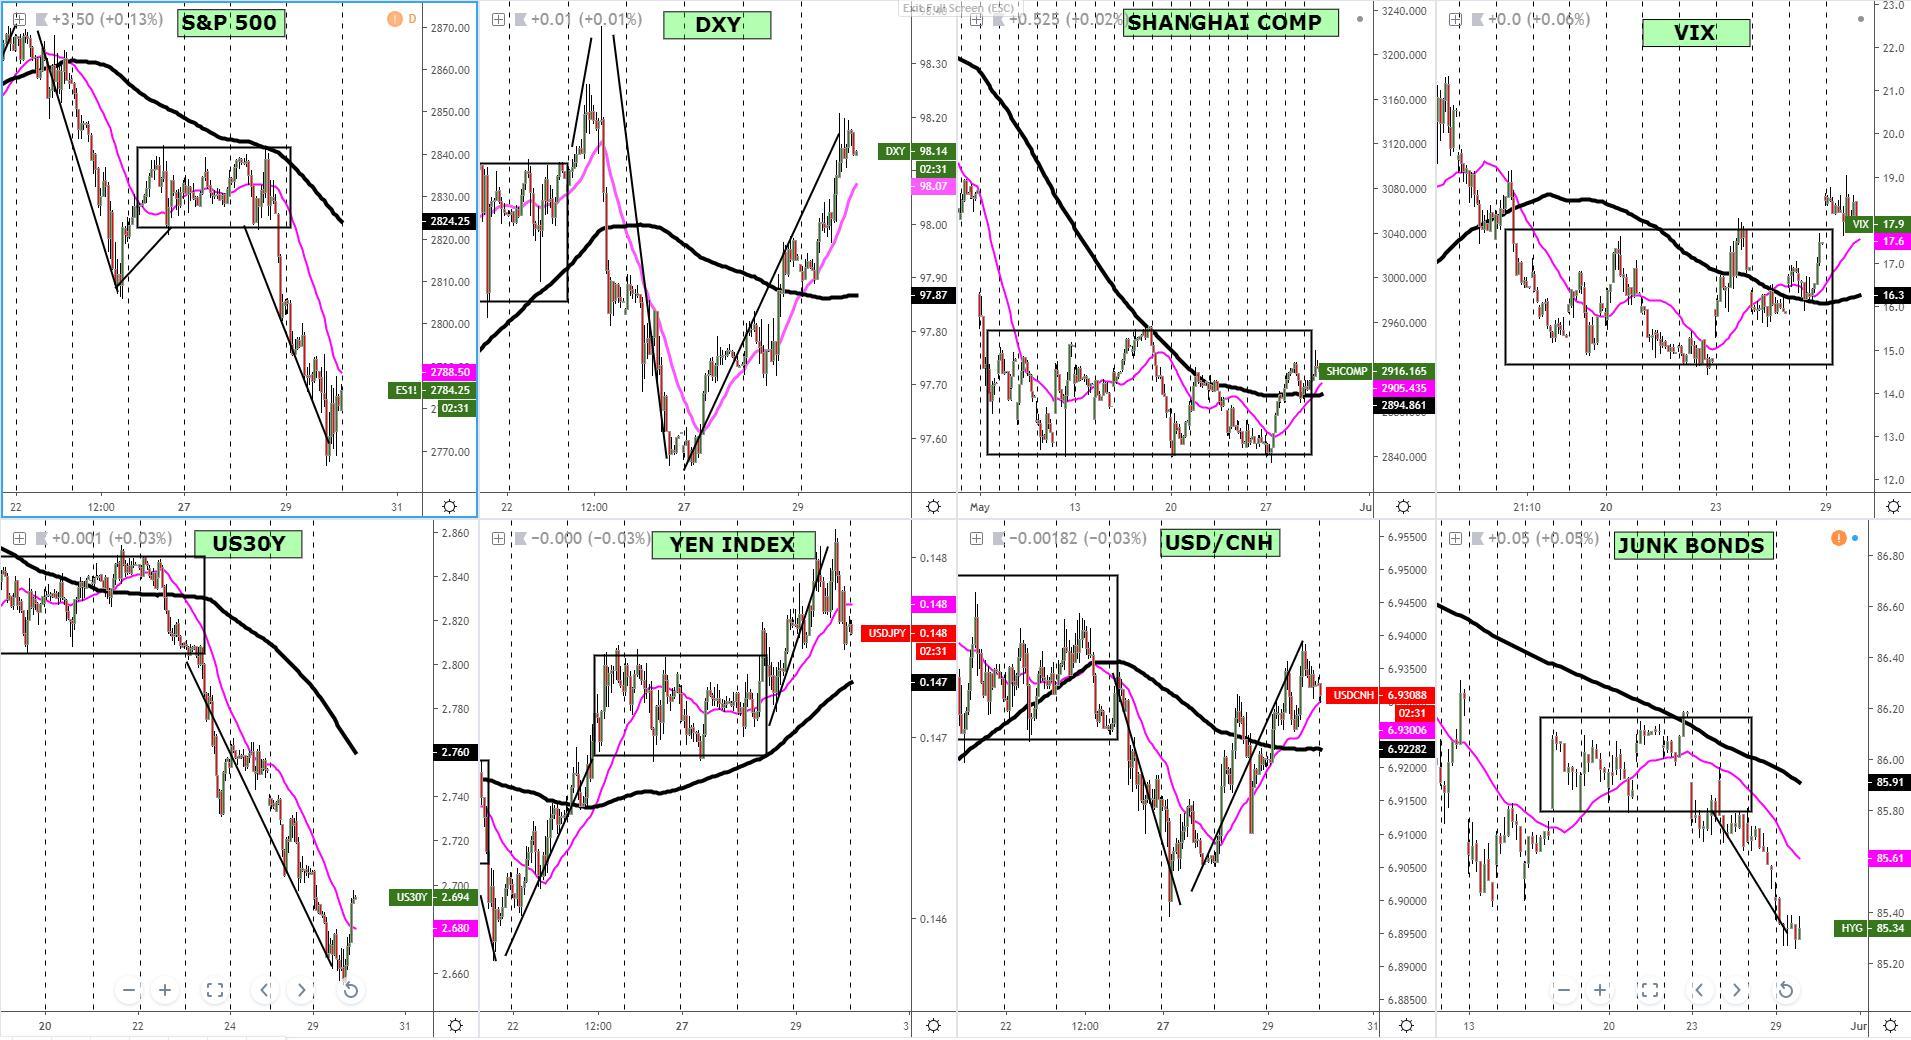
The hostile backdrop in trade relationships between the US and China no longer defies logic with markets behaving in congruence with the heightened risks of a global slowdown. The persistent selling in the S&P 500, where waves of impulsive selling are counterbalanced with tepid upside corrections, allows us a clear conclusion, that is, an aggressive re-pricing of the growth outlook, with the US no longer immune as the Fed’s favorite 3m/10y yield curve inversion reflects. Take a look at the chart below, which clearly depicts the sync bearish mode in yield curves across major economies.
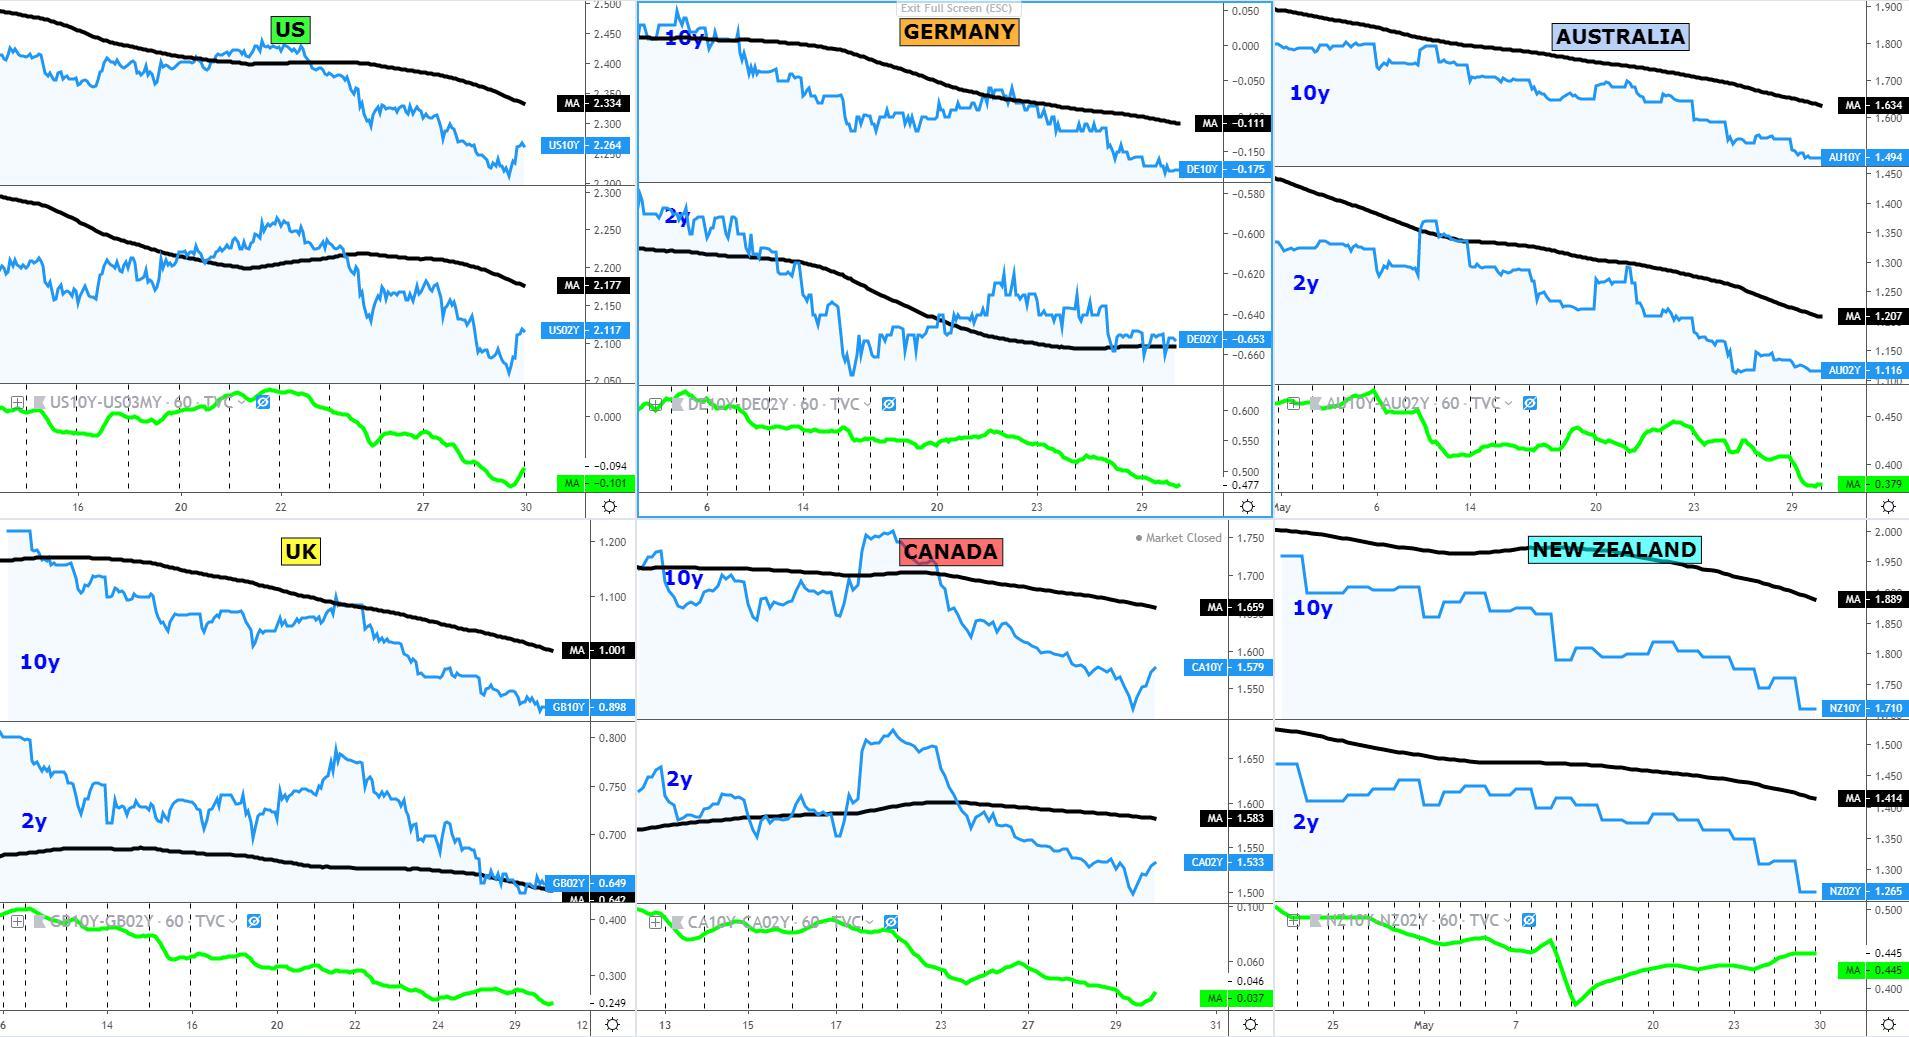
While the trend should be your friend after some ruthless selling for over 2 weeks in US yields, the poor bid to cover in Wednesday’s 7y US bond auction has led to a relief rally in yields across all maturities, which as I stated above, it may be an indication that the market may be reaching levels of exhaustion. This is important to monitor because a transition into more balanced flows in yields has a direct impact in how currencies the likes of the Japanese Yen or the US Dollar may trade. But make no mistake, the structures in the Yen index, the DXY, which has put up a great fight in the last 3 days, alongside the valuations in Chinese assets, as well as VIX and junk bonds, all communicates the same message. We are in clear ‘true risk off’ environment likely to keep rallies in risk assets limited.
Latest Key Developments In FX (Technicals, Fundamentals, Intermarket)
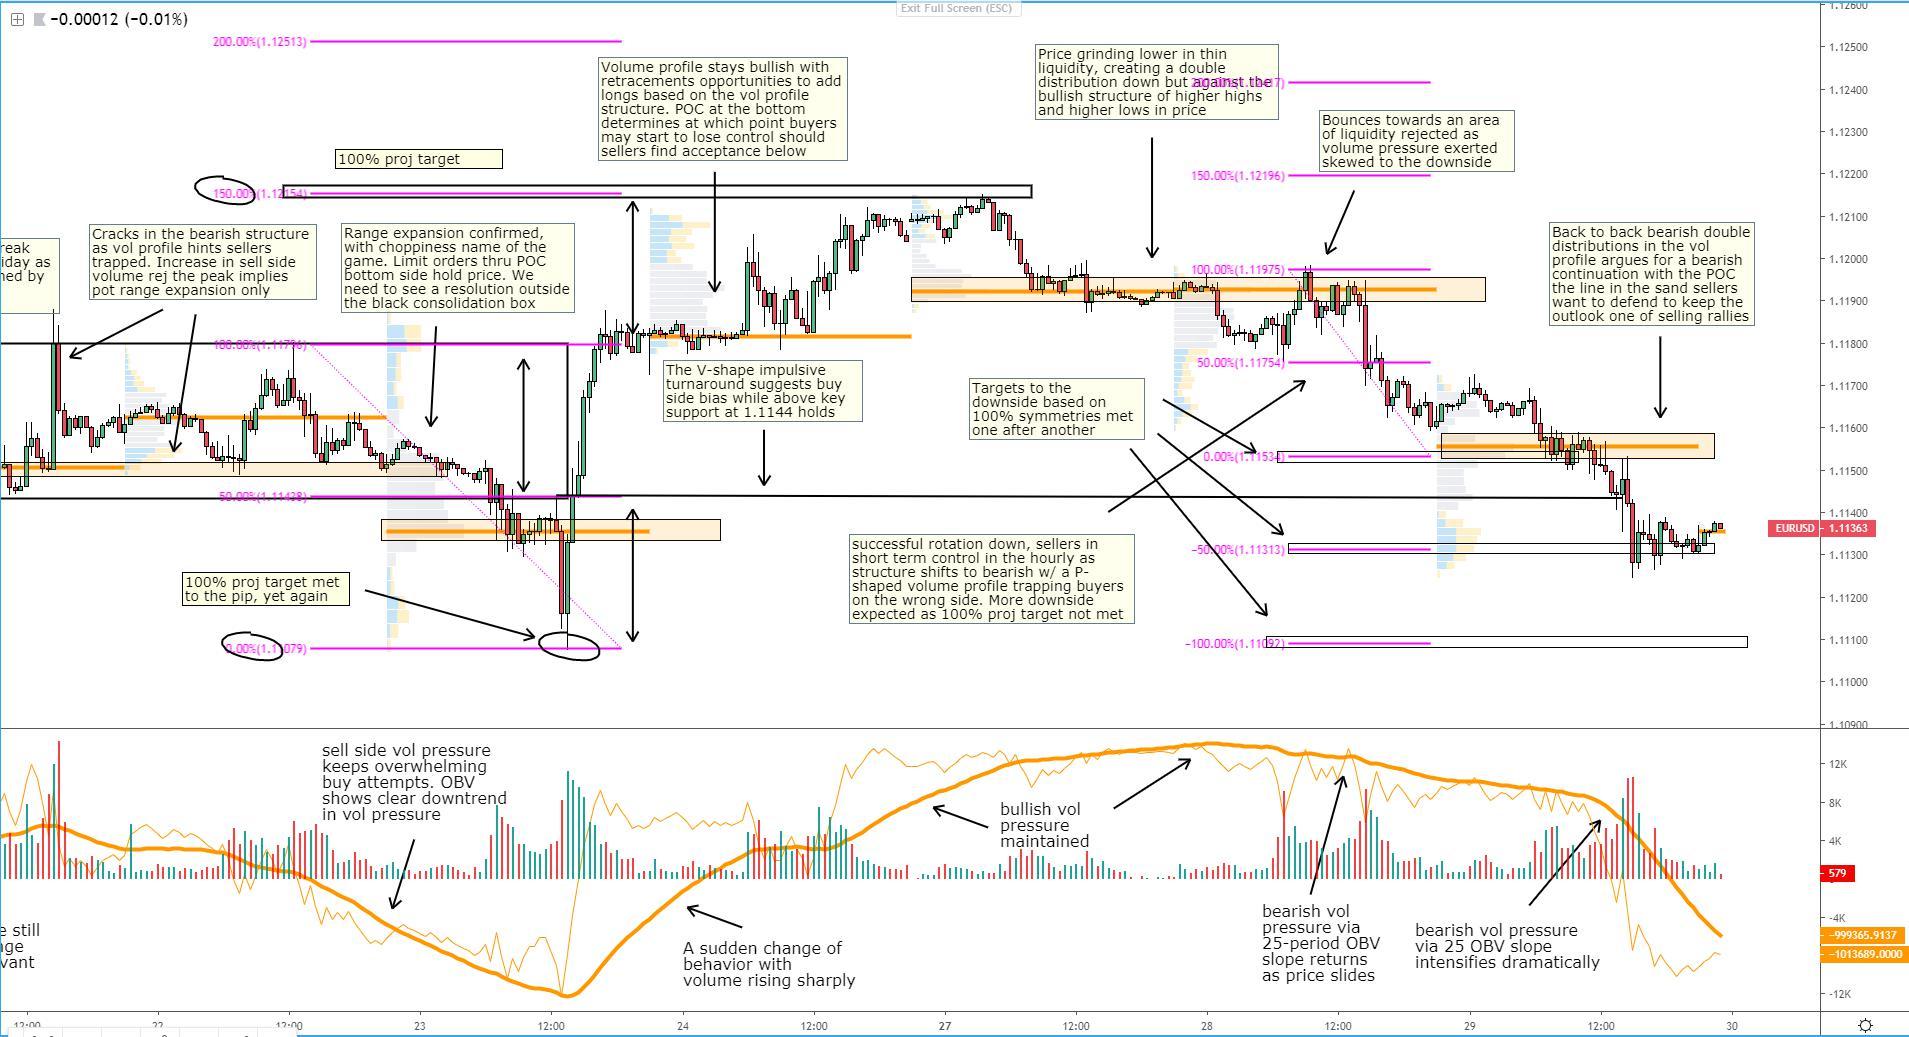
EUR/USD: Back-to-Back Bearish Double Distributions
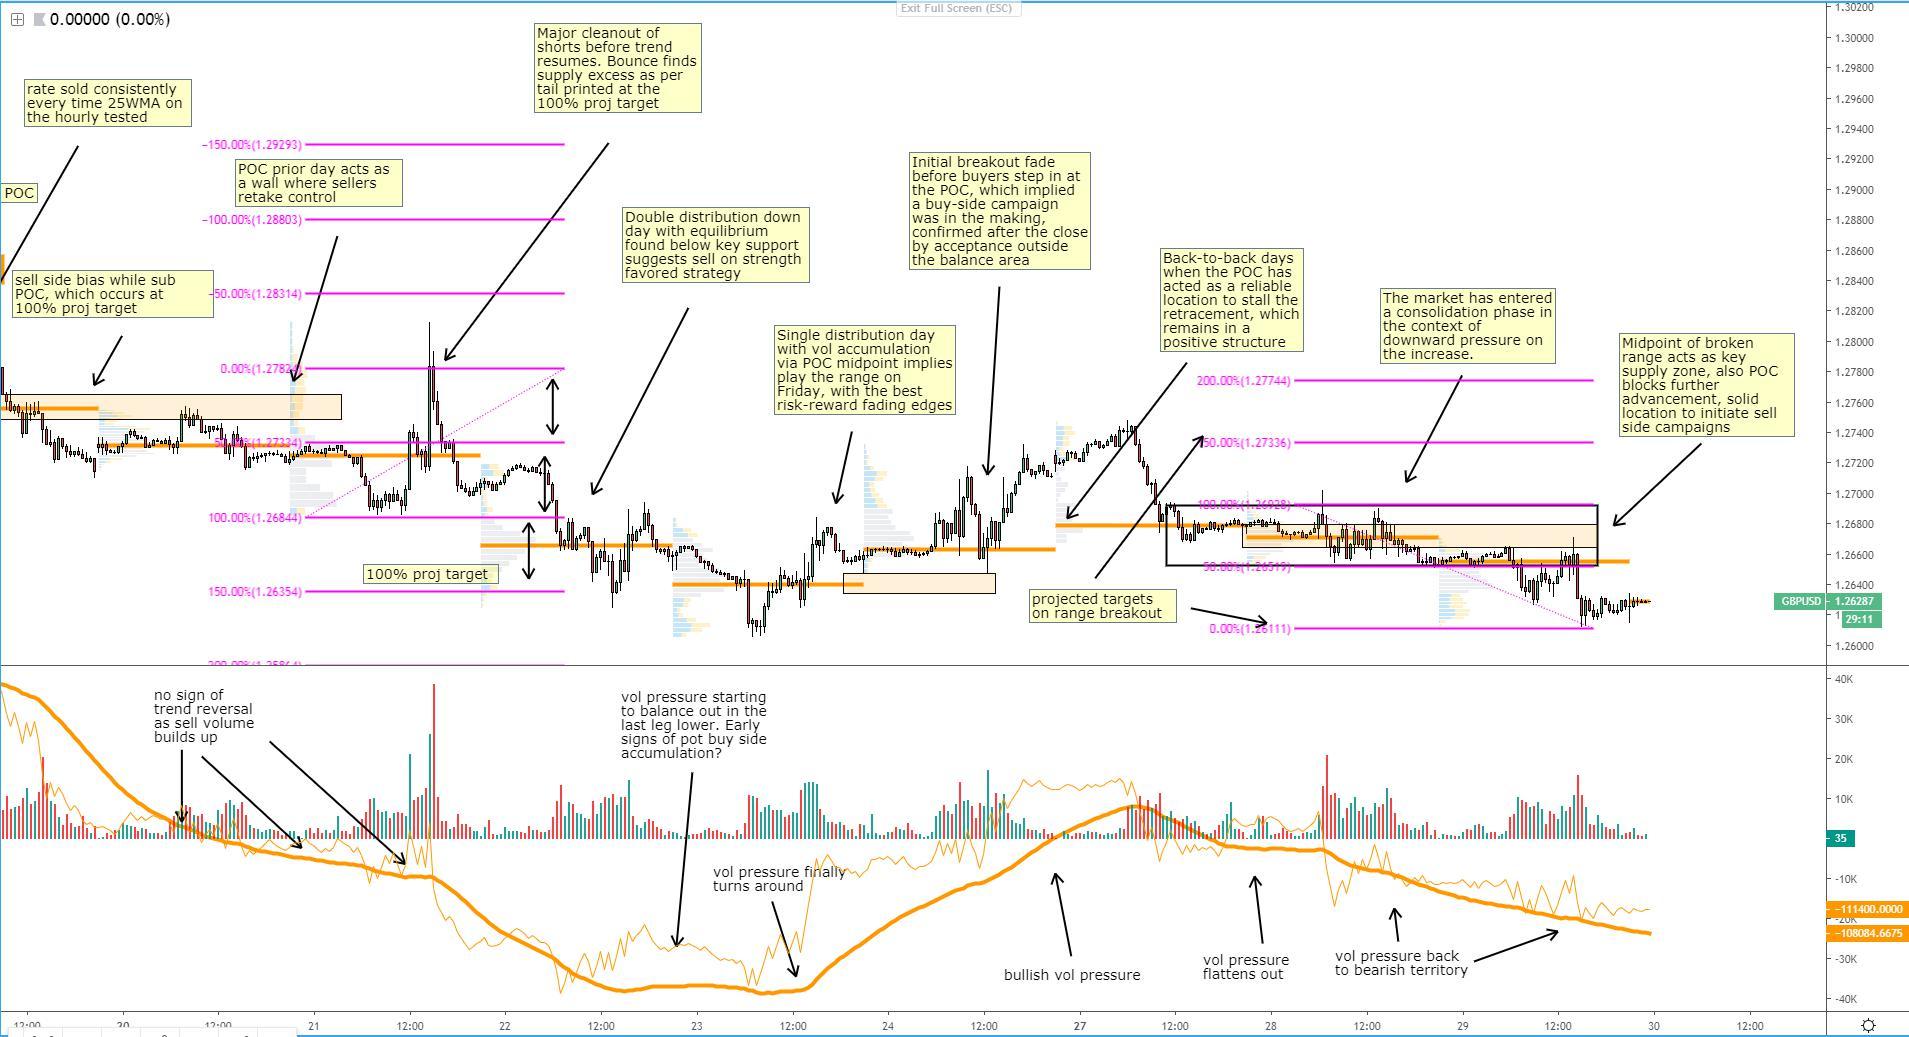
GBP/USD: POC Keeps Bears In Control, 100% Goal Met
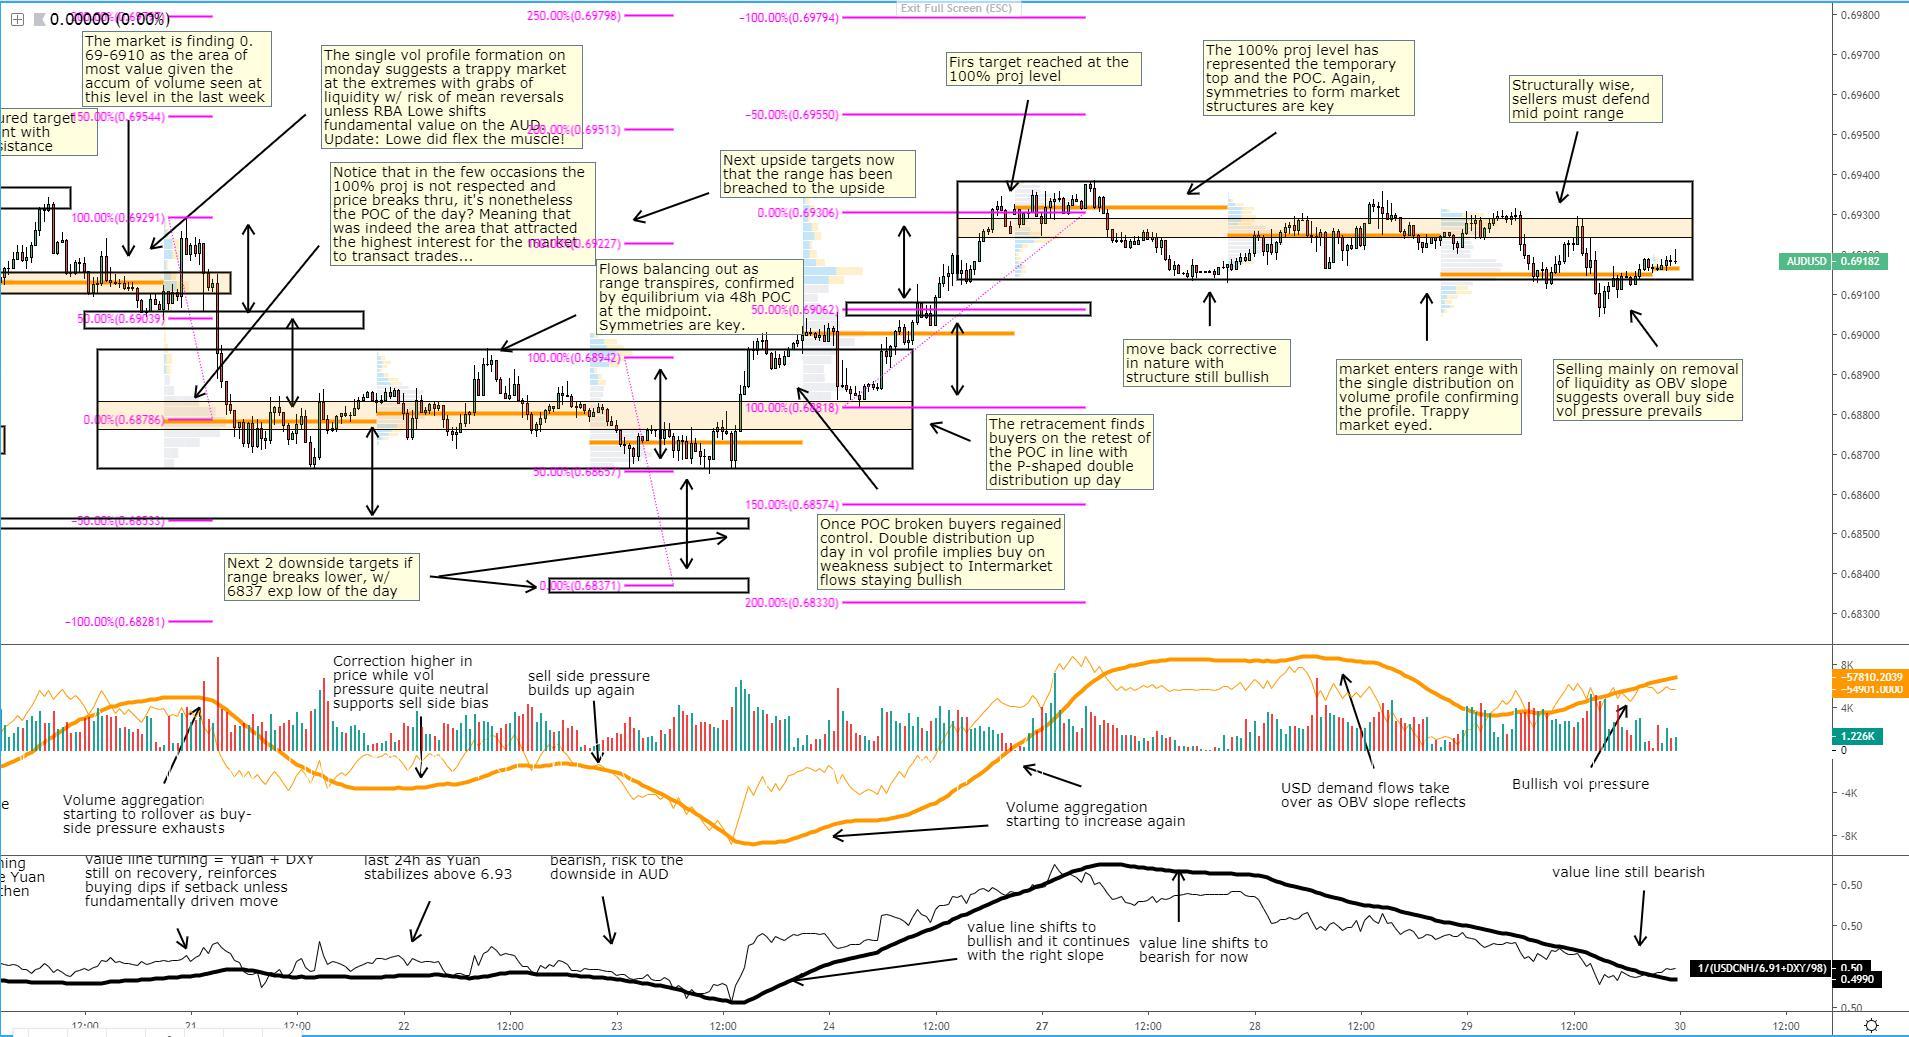
AUD/USD: Breaks Range W/ Value But No Volume
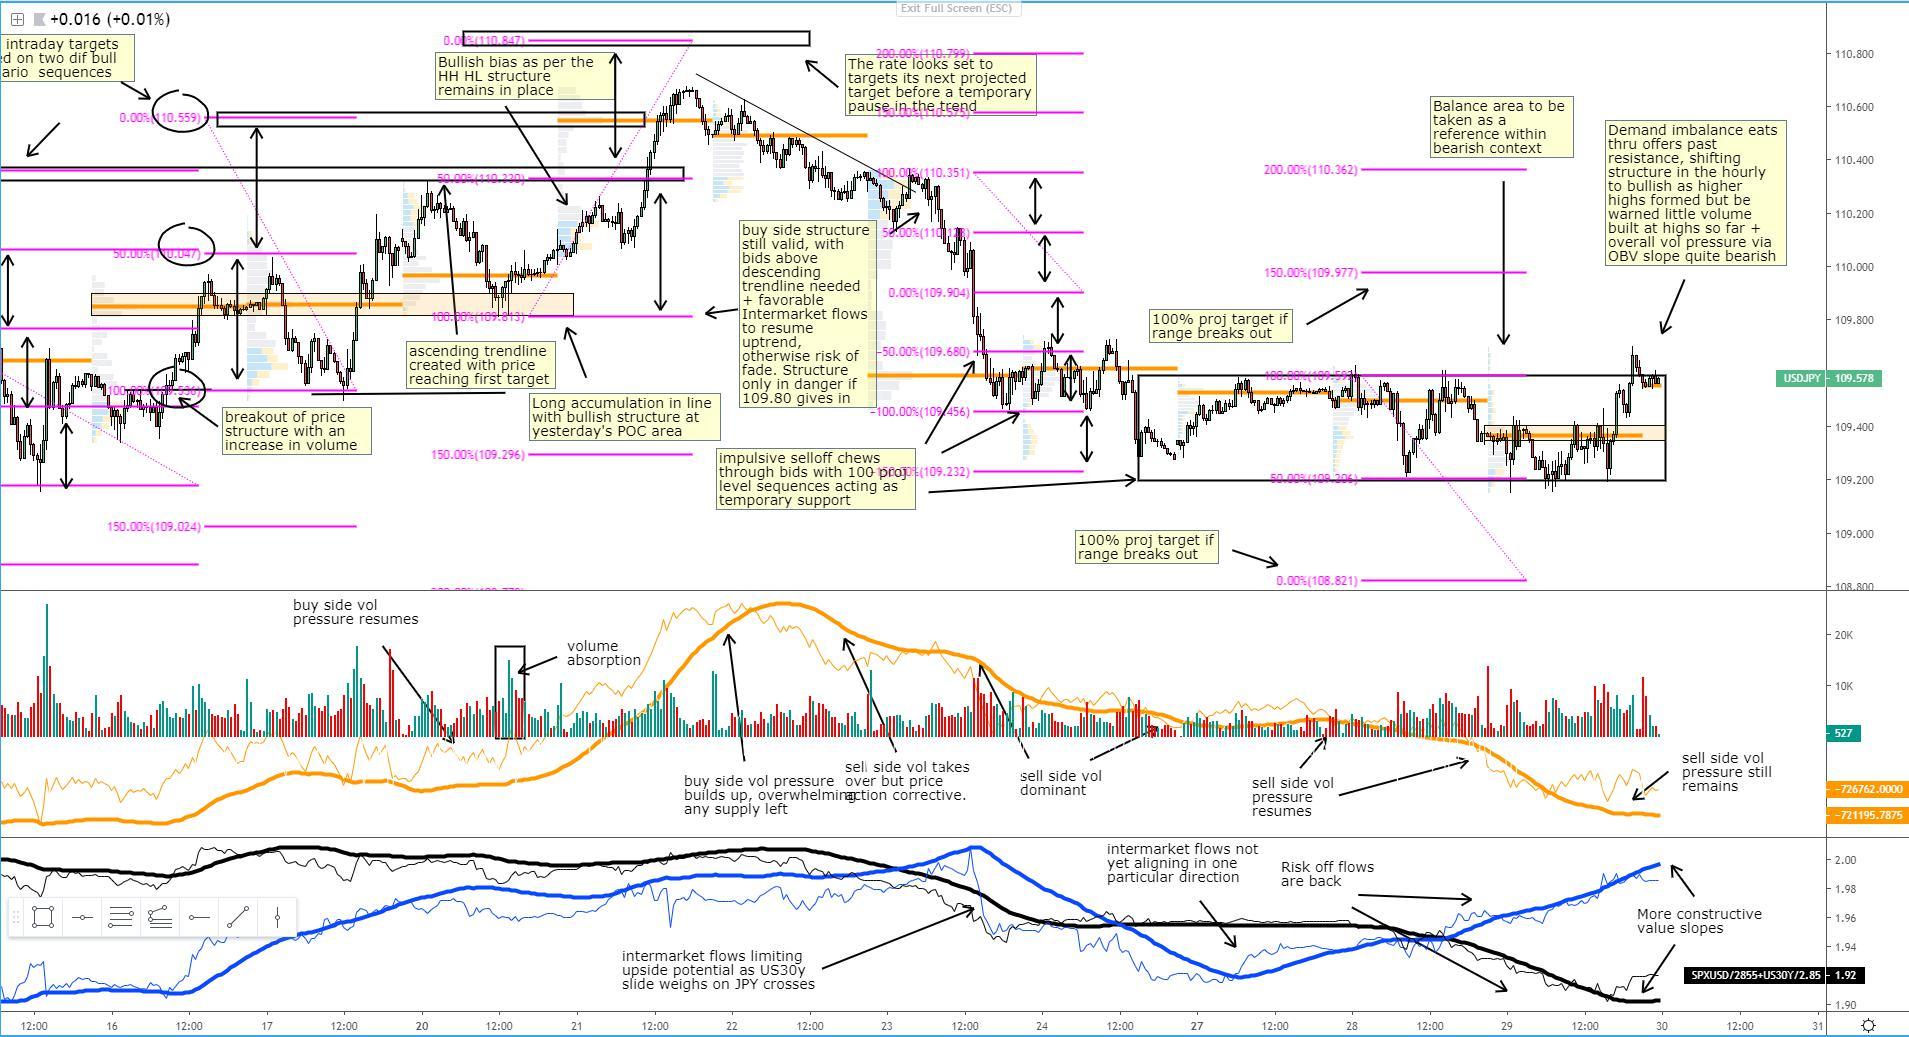
USD/JPY: Structure Shifted to Bullish, Volume Not Supportive
Important Footnotes
- Risk model: The fact that financial markets have become so intertwined and dynamic makes it essential to stay constantly in tune with market conditions and adapt to new environments. This prop model will assist you to gauge the context that you are trading so that you can significantly reduce the downside risks. To understand the principles applied in the assessment of this model, refer to the tutorial How to Unpack Risk Sentiment Profiles
- Cycles: Markets evolve in cycles followed by a period of distribution and/or accumulation. The weekly cycles are highlighted in red, blue refers to the daily, while the black lines represent the hourly cycles. To understand the principles applied in the assessment of cycles, refer to the tutorial How To Read Market Structures In Forex
- POC: It refers to the point of control. It represents the areas of most interest by trading volume and should act as walls of bids/offers that may result in price reversals. The volume profile analysis tracks trading activity over a specified time period at specified price levels. The study reveals the constant evolution of the market auction process. If you wish to find out more about the importance of the POC, refer to the tutorial How to Read Volume Profile Structures
- Tick Volume: Price updates activity provides great insights into the actual buy or sell-side commitment to be engaged into a specific directional movement. Studies validate that price updates (tick volume) are highly correlated to actual traded volume, with the correlation being very high, when looking at hourly data. If you wish to find out more about the importance tick volume, refer to the tutorial on Why Is Tick Volume Important To Monitor?
- Horizontal Support/Resistance: Unlike levels of dynamic support or resistance or more subjective measurements such as fibonacci retracements, pivot points, trendlines, or other forms of reactive areas, the horizontal lines of support and resistance are universal concepts used by the majority of market participants. It, therefore, makes the areas the most widely followed and relevant to monitor. The Ultimate Guide To Identify Areas Of High Interest In Any Market
- Trendlines: Besides the horizontal lines, trendlines are helpful as a visual representation of the trend. The trendlines are drawn respecting a series of rules that determine the validation of a new cycle being created. Therefore, these trendline drawn in the chart hinge to a certain interpretation of market structures.
- Correlations: Each forex pair has a series of highly correlated assets to assess valuations. This type of study is called inter-market analysis and it involves scoping out anomalies in the ever-evolving global interconnectivity between equities, bonds, currencies, and commodities. If you would like to understand more about this concept, refer to the tutorial How Divergence In Correlated Assets Can Help You Add An Edge.
- Fundamentals: It’s important to highlight that the daily market outlook provided in this report is subject to the impact of the fundamental news. Any unexpected news may cause the price to behave erratically in the short term.
- Projection Targets: The usefulness of the 100% projection resides in the symmetry and harmonic relationships of market cycles. By drawing a 100% projection, you can anticipate the area in the chart where some type of pause and potential reversals in price is likely to occur, due to 1. The side in control of the cycle takes profits 2. Counter-trend positions are added by contrarian players 3. These are price points where limit orders are set by market-makers. You can find out more by reading the tutorial on The Magical 100% Fibonacci Projection
The Daily Edge is authored by Ivan Delgado, Market Insights Commentator at Global Prime. The purpose of this content is to provide an assessment of the market conditions. The report takes an in-depth look of market dynamics, factoring in fundamentals, technicals, inter-market in order to determine daily biases and assist one’s decisions on a regular basis. Feel free to follow Ivan on Twitter & Youtube.

