
Quick Take
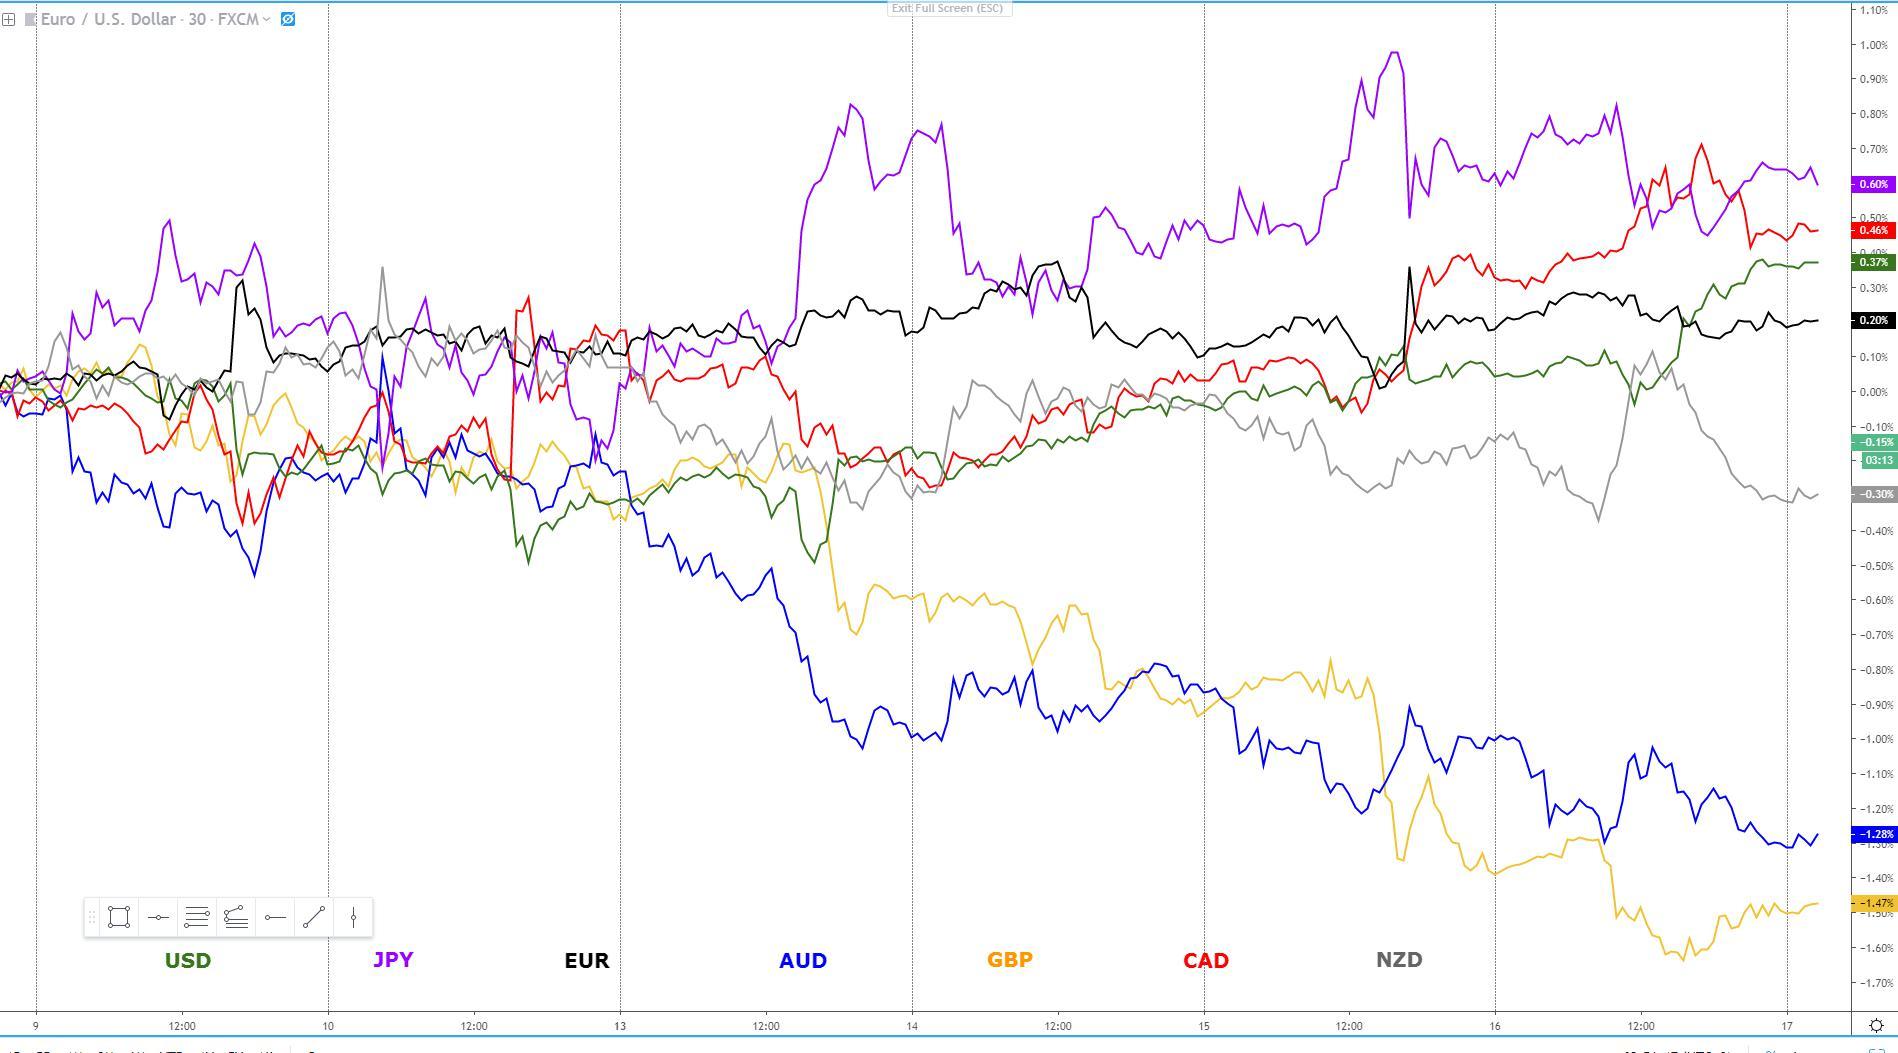
It cannot be argued that risk continues to be on the mend. Equities found fresh buyers, bonds sold, the VIX came down to 15.00, but still, a key question must be asked. Is the market growing excessively complacent to the risks stemming from the new highs in USD/CNH? The ongoing depreciation in the Yuan tells us the market is not buying into the thesis that China and the US will reconcile their hard-line stance on trade, which leads me to think, the disconnect between risk up and Yuan down cannot go on much longer. In the meantime, the Yen has been sold in response to more benign conditions as the market goes through a round of re-leveraging into riskier assets. The USD, at times a candidate to depreciate when the market goes 'risk on', seems to find a greater endorsement by buy-side accounts on positive US data and improved 'carry trade' dynamics. The Canadian dollar, even if fears of Oil supply disruption in the Middle East keeps the price of Oil underpinned, failed to sustain its strong buy side momentum from early Europe. The three currencies that are finding relentless follow-through sell side flows include the AUD, NZD and the GBP. The former Oceanic block in response to lower Yuan valuations and a mixed Australian employment report, while the GBP remains in incessant selling pressure, driven by technicals, which has deteriorated due to the uncertainty in the Brexit front as Theresa May starts to consider her own (Br) exit strategy as Prime Minister amid the protracted impasse on her withdrawal agreement.
Narratives In Financial Markets
* The Information is gathered by scanning top publications including the FT, WSJ, Reuters, Bloomberg, ForexLive, Institutional Bank Research reports.
- A slew of 2nd tier US data contributed to the bid tone in the US Dollar. Interestingly, ever since the US-China trade fractures, the currency appears to be trading in strong correlation with the lowering of the VIX (equities’ implied volatility). From the basis of a revival of the USD carry trade as a function to a pick up in risk flows, has its logic.
- US President Trump’s executive order to restrict Huawei and other Chinese telecom companies’ products from being used as part of the US telecom infrastructure has so far not caused any effect in risk flows, with positive US earnings outweighing the negatives.
- Even if the reversal in risk flows is undeniable by looking at the price action in equities or fixed income, the incessant rise in the USD/CNH is a major red flag. The lower the Yuan goes while equities move in the opposite direction, the greater the disconnect that exists, as the Yuan continues to be the ‘leading’ indicator of the extent in which the market believes a US-China trade deal will occur. The Yuan level tells us ‘slim chances’, which essentially translates in complacency biding up risk under such a premise.
- Australia's jobs growth in April came strong at +28k but a jump in the participation rate saw the unemployment rate increase to 5.2%. According to Morgan Stanley (NYSE:MS), “we saw enough positives that the RBA can point to in this release that they won't cut rates until August, later than market pricing. The mix was poor with -6k full-time jobs lost but this reflected payback from previous month's strength - YTD more full-time than part-time jobs have been added.”
- Judging by the bank research reports I got my hands on this morning (Danske Bank, Credit Agricole (PA:CAGR), Morgan Stanley, HSBC, to name a few), the general consensus is that the US and China are moving towards a full-blown trade war. While it’s still early days to speculate in such a scenario and more attempts will be made to reconcile positions, it’s a tough road ahead as China has started to recognize no US demands while coming before its national interests.
- Talk has it that Theresa May is mulling a timetable to step down from her role as UK Prime Minister. Her plans to resign will be outlined once a parliamentary vote on the withdrawal agreement in early June takes place, according to the latest reports by the British press. The reports making headlines on Thursday indicate if the vote is lost, May will resign with immediate effect. On the contrary, if she can strike a deal with Labour that allows the Brexit vote to pass parliament, her intention is to remain in office to pass the bill into law before the end of July, after which she still plans to step down as Prime Minister.
- Falling US gasoline inventories, near the lowest levels since November, coupled with fears of potential disruption in oil supply due to an escalation of tensions in the Middle East (Strait of Hormuz) have kept the bid tone in Oil prices, underpinning the CAD, except vs USD.
- BoC’s Poloz held a press conference about the Financial System Review, where he sounded rather optimistic that growth is en-route to pick up later this year. Judging by the latest growth data in Canada, it looks like fundamentals could indeed overshoot the Central Bank’s modest targets for the remainder of 2019, subject to the global growth outlook (China-US trade).
- Wilbur Ross, US Commerce Secretary, said that Trump has many options on the table when it comes to the handling of auto tariffs, which is a decision due by Saturday, May 18. So far, the market assumes that tariffs are set to be delayed by up to 6 months, which led to a relief rally in risk via equities late on Wednesday, only to extend the momentum on Thursday.
- While historically not greatly affected by political events, the Australia Dollar faces a risk event this weekend, due to the national election. According to the most recent polls, cited via Reuters, the opposition Labour party is marginally ahead of the current coalition government by just 1bp 51-49.
Recent Economic Indicators & Events Ahead
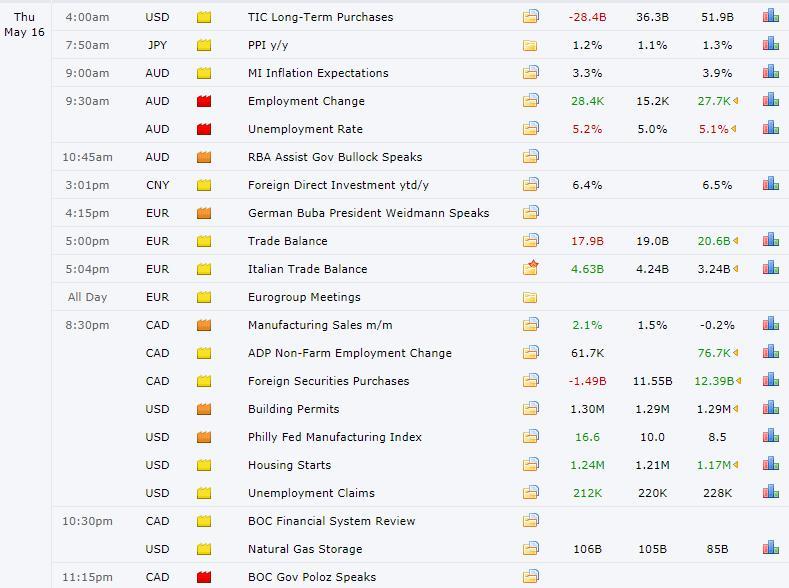
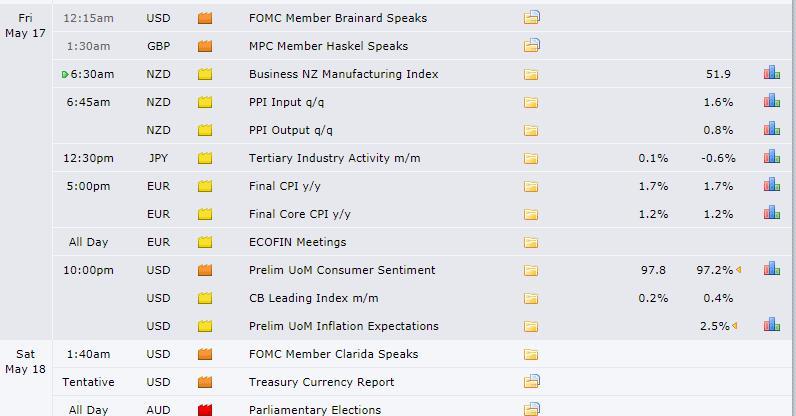
Source: Forexfactory
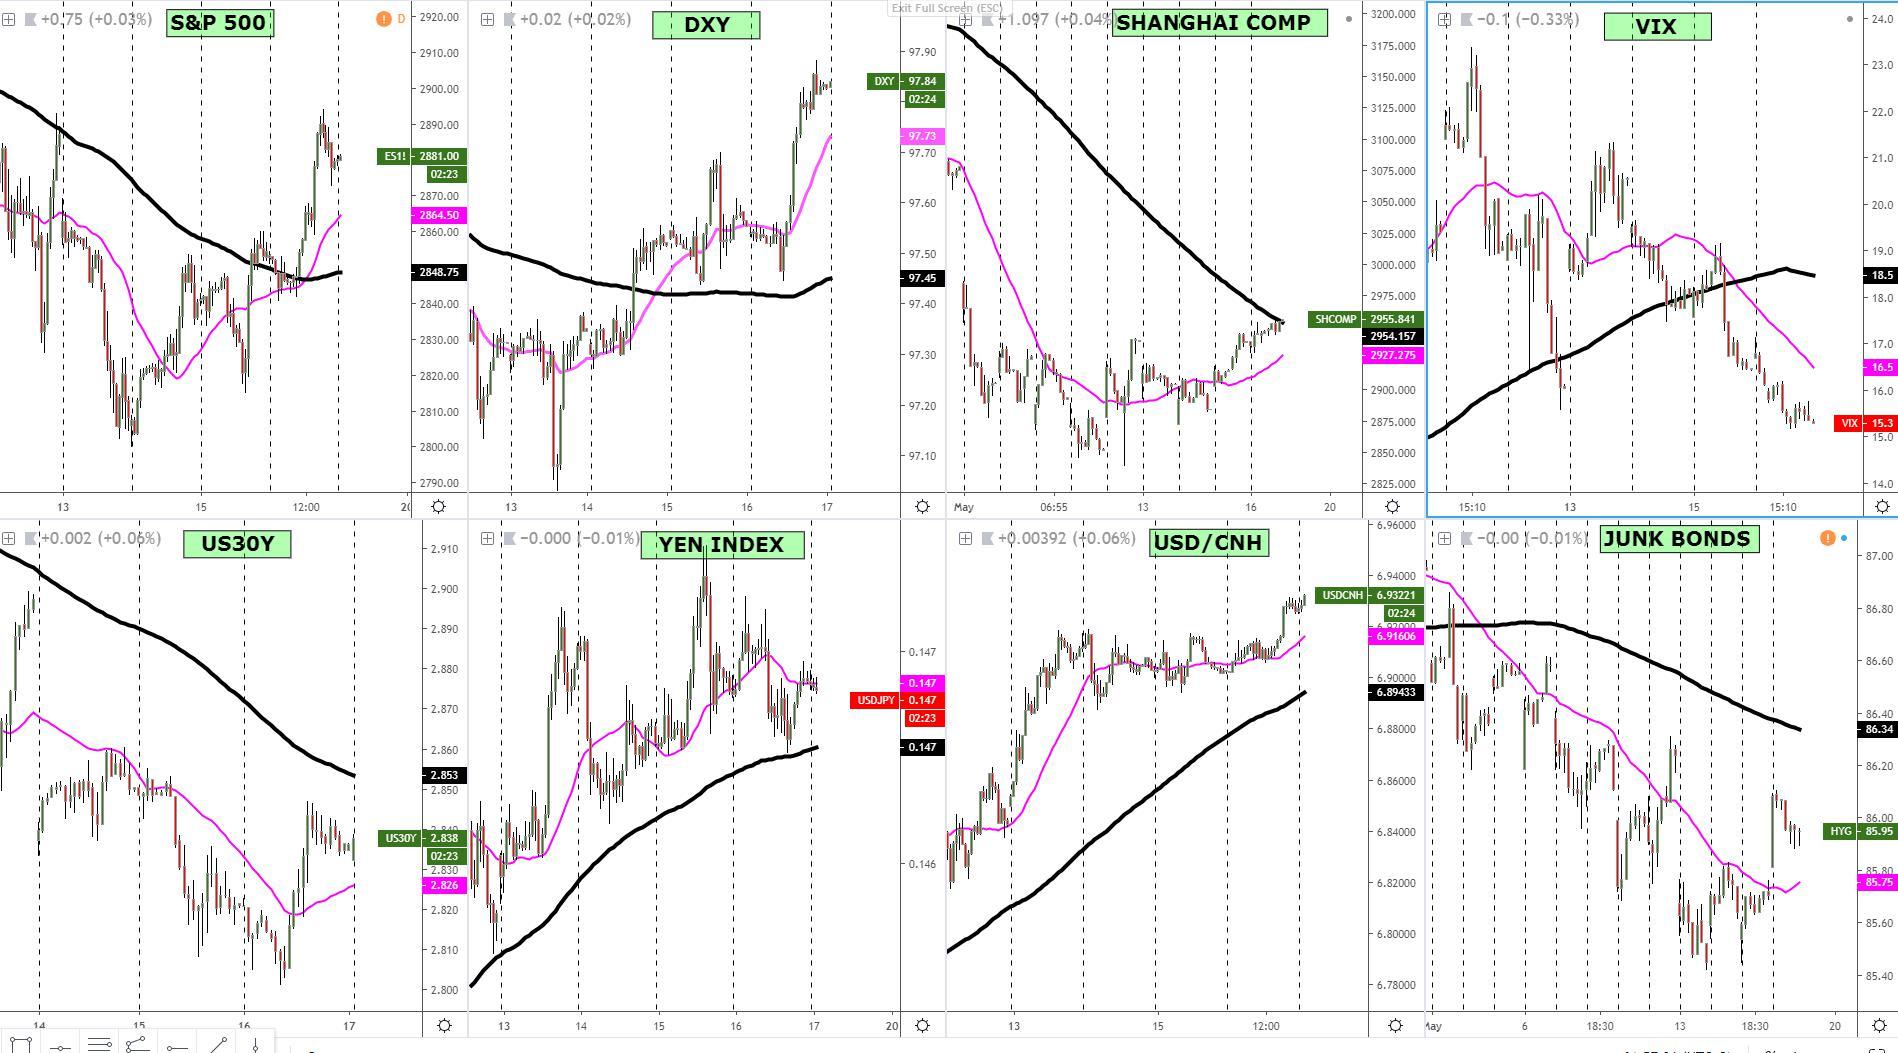
RORO (Risk On, Risk Off Conditions)
For the first time since the US-China knocked heads in the trade negotiation process almost 2 weeks ago, the S&P 500 has finally found enough buying interest to shift the focus back to the upside. Not only the hourly structure, based on the Dow Theory, is building higher highs and higher lows, but the micro and macro slopes, represented via the 25 and 125-HMAs, have reverted back to bullish. The drop in the VIX towards the 15.00, paired with higher pricing in junk bonds, aided the bull run.
When it comes to the US fixed-income, the picture is not as rosy, even if the run higher holds its fair share of merit considering the US-China stalemate in trade. Unlike the S&P 500, the US 30y bond yield is yet to break its bearish structure and revert its macro slope from its current bearish bias.
The bullish run in the DXY, at this stage, is not a function of risk conditions, but rather it appears to be mainly driven by improving US fundamentals, as per Thursday’s positive economic data, alongside the lowering of implied volatility in equities, which alongside the globally synchronized dovish bias by Central Banks, still promotes the idea of buying USDs as a vehicle to get yield via ‘carry trade’.
Interestingly, the recent ‘risk on’ flows in equities is yet to debunk the prognosis of a market in full ‘true risk on’. Based on the price action of the Japanese Yen index, it’s far too early to speculate on a sustained recovery in risk as the market has simply permuted into a period of consolidation. The bullish macro slope and the absence of a clean bearish price structure prove this point.
The ability of the RORO model to act as an accurate analytical tool in order to assess risk conditions, without a doubt, hinges on the performance of Chinese assets, intertwined like never before to the manifestation, via price action, of where the market sees the US-China trade talks heading.
The new highs in USD/CNY, getting into closer contact with 7.00, reveals a story of ‘disbelief’ about the ability of neither China nor the US to back off from their respective trade demands (no side interested in losing face here), with the depreciation of the Yuan a byproduct of the dire outlook in upcoming talks. The performance of Chinese equities, while improving, remains too modest in nature to read too much into it, especially when China’s sponsored funds have contributed to the rebound.
 Latest Key Developments In FX (Technicals, Fundamentals, Intermarket)
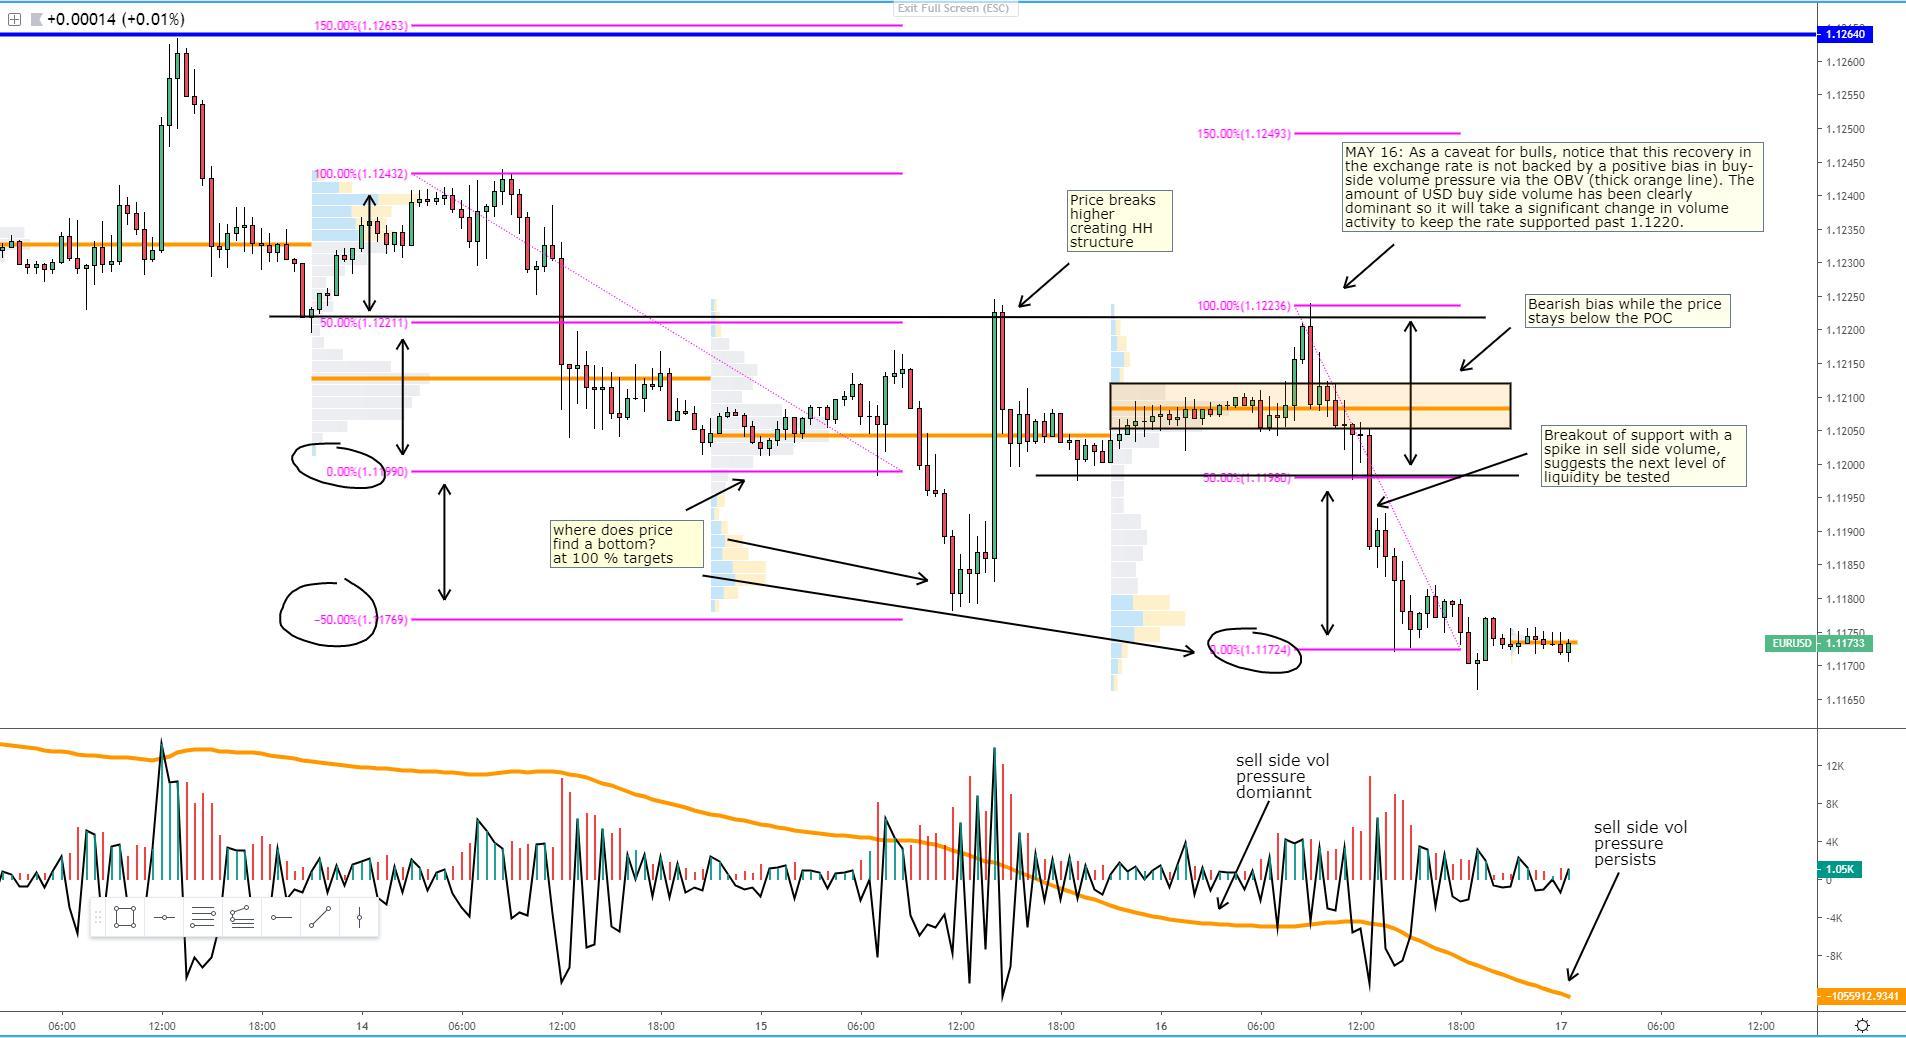
EUR/USD: Completes Next 100% Measured Move Target
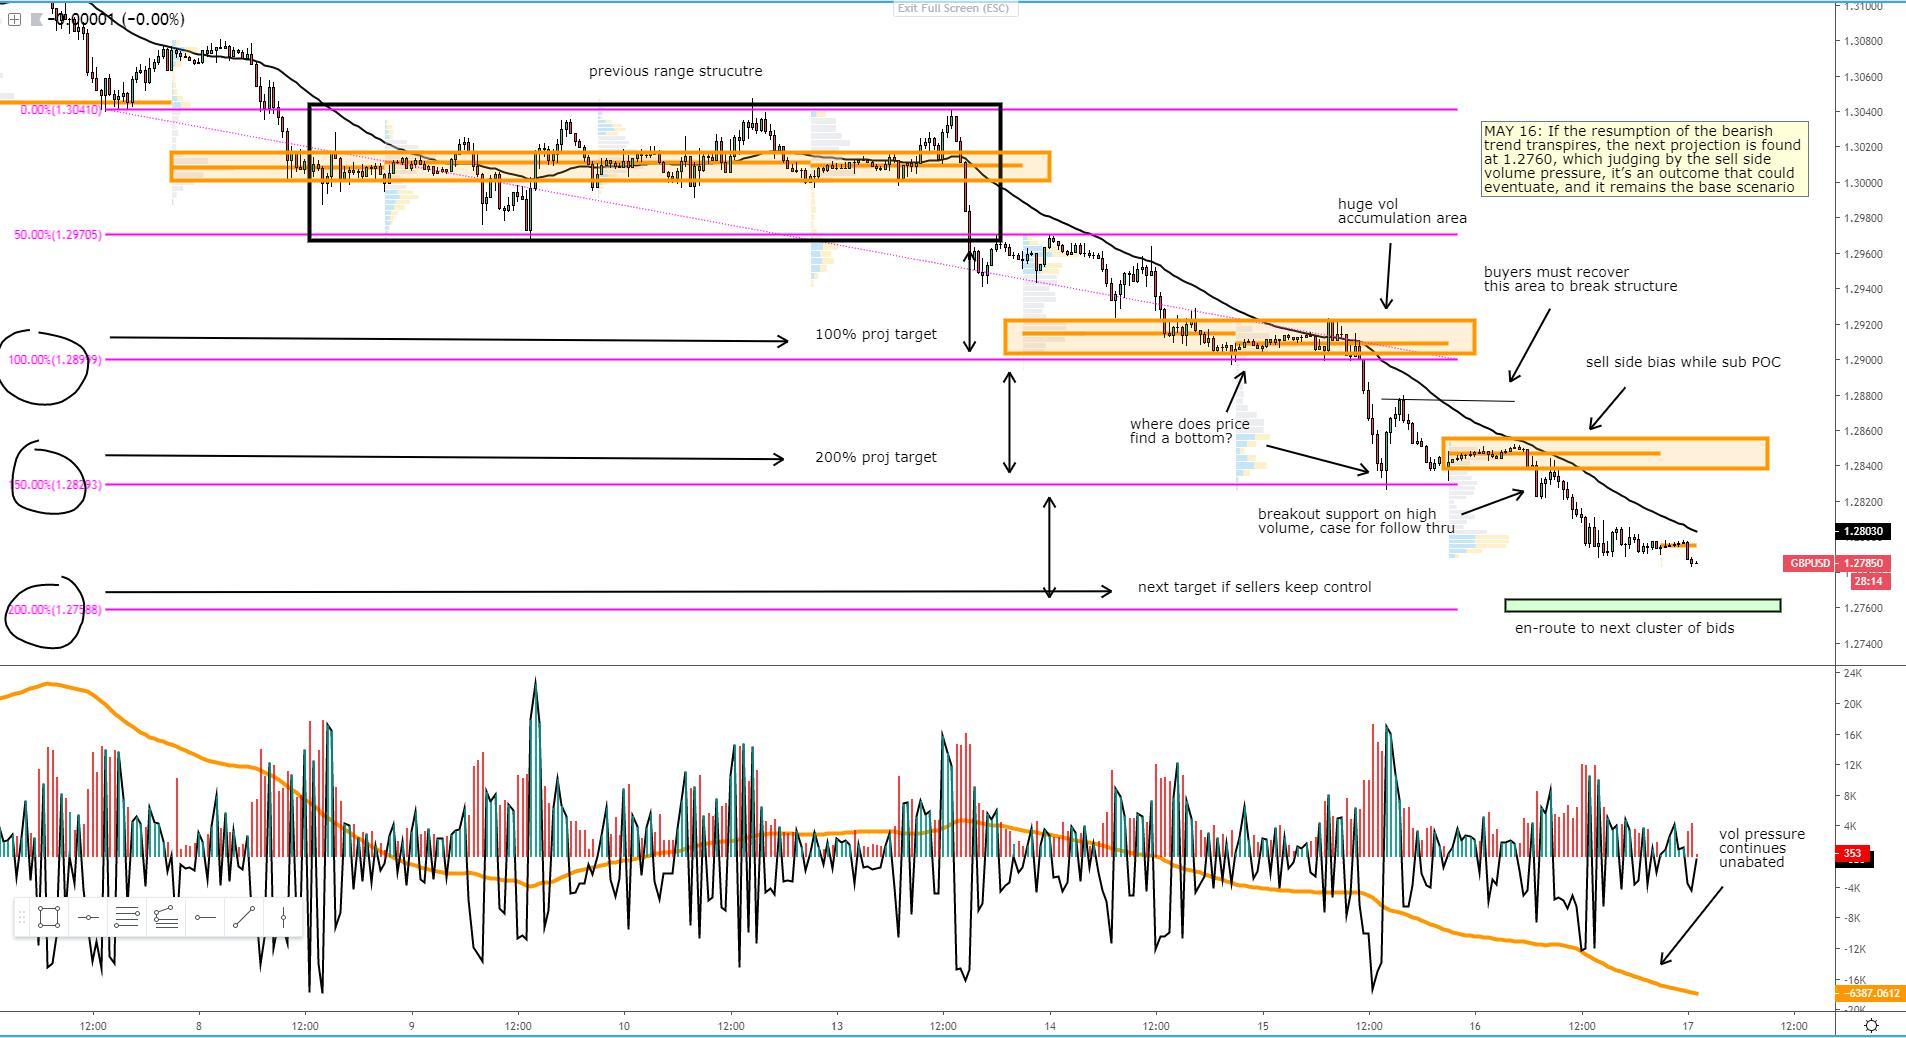
GBP/USD: En-Route To Next Bearish Target (NYSE:TGT)
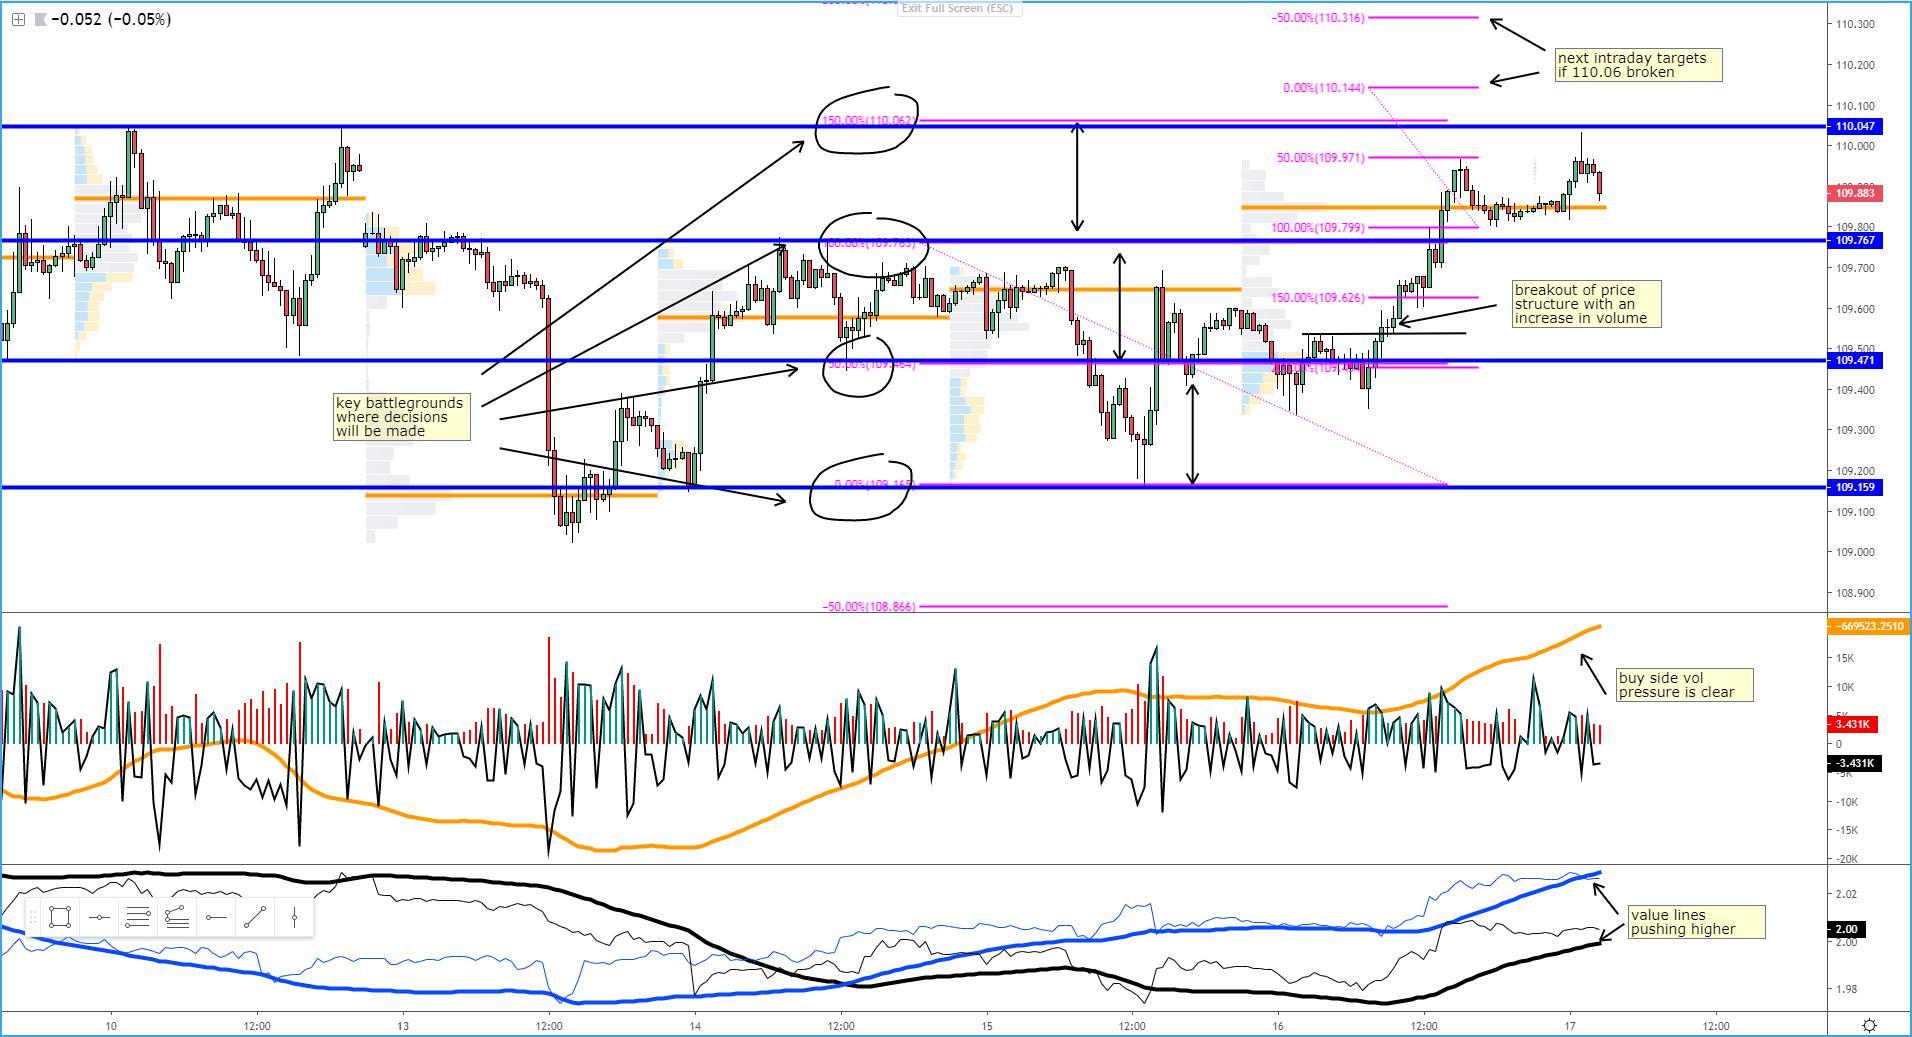
USD/JPY: Buyers Take Back Control
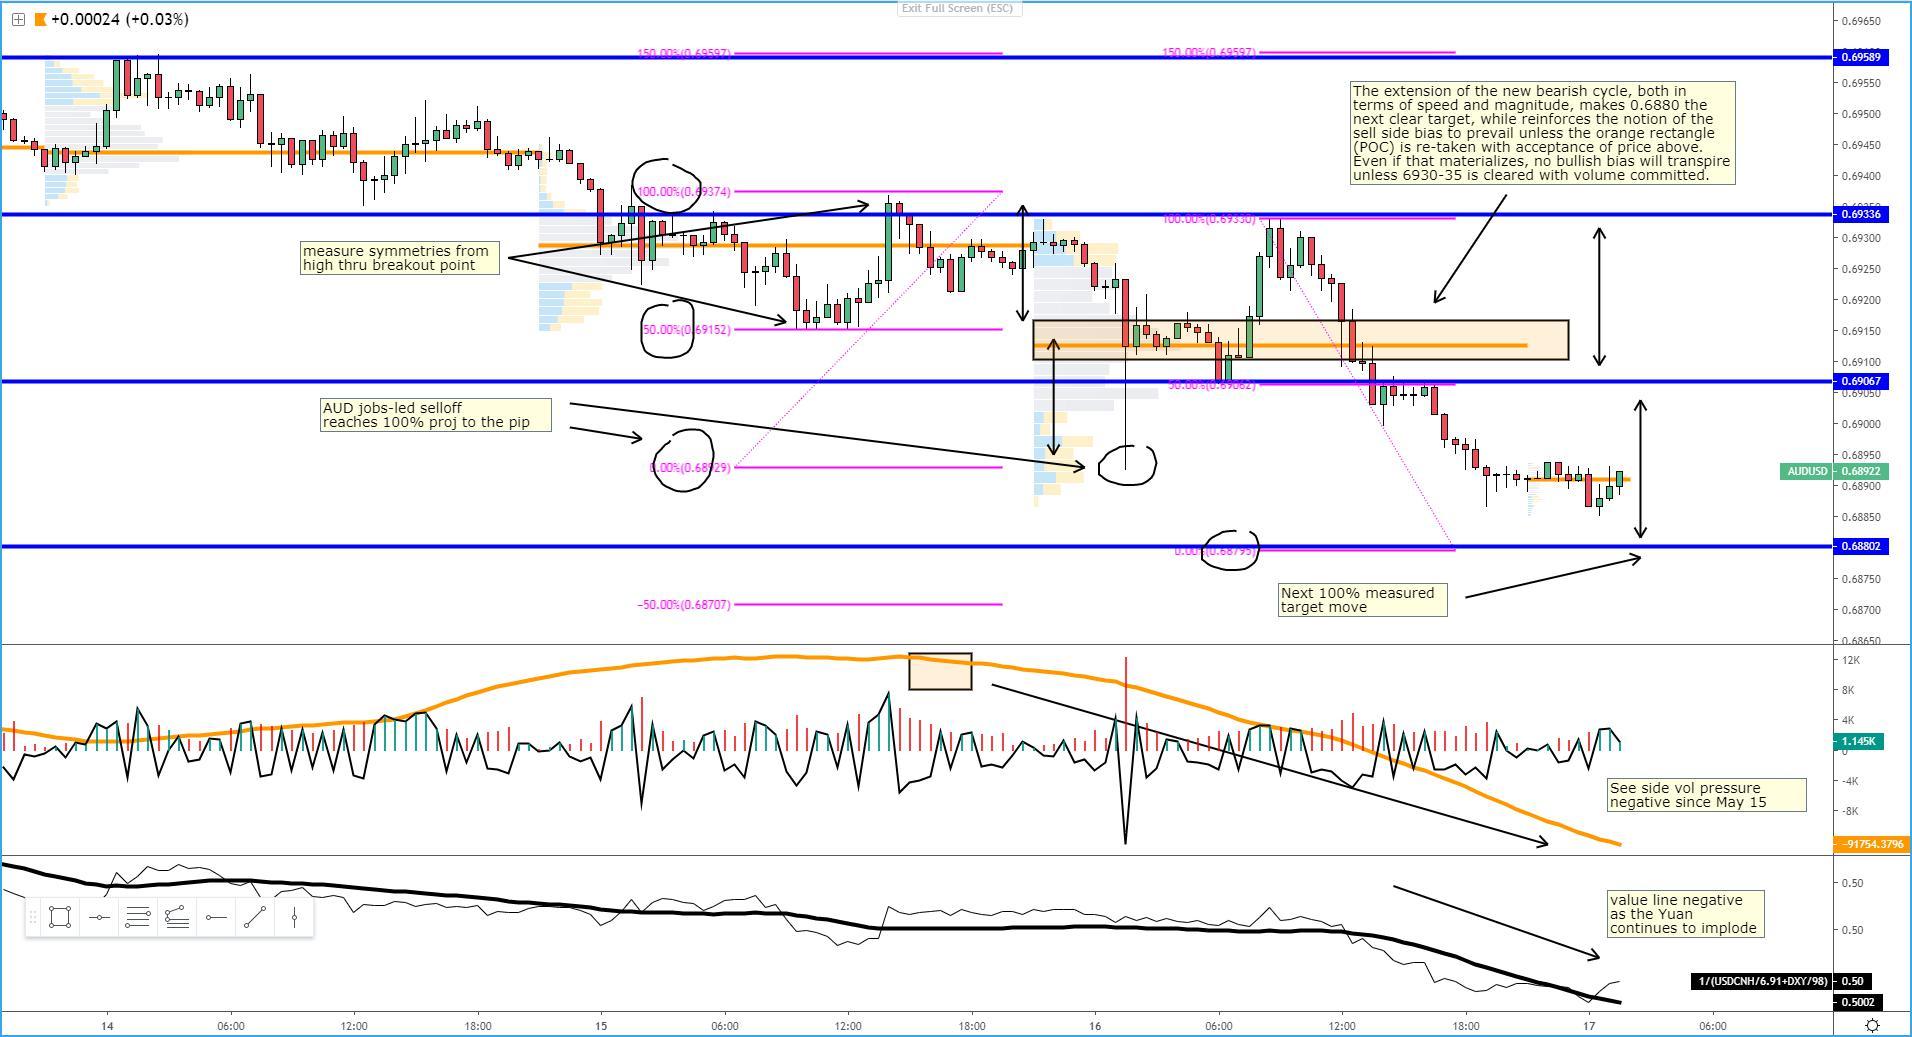
AUD/USD: More Pain For The Aussie Eyed
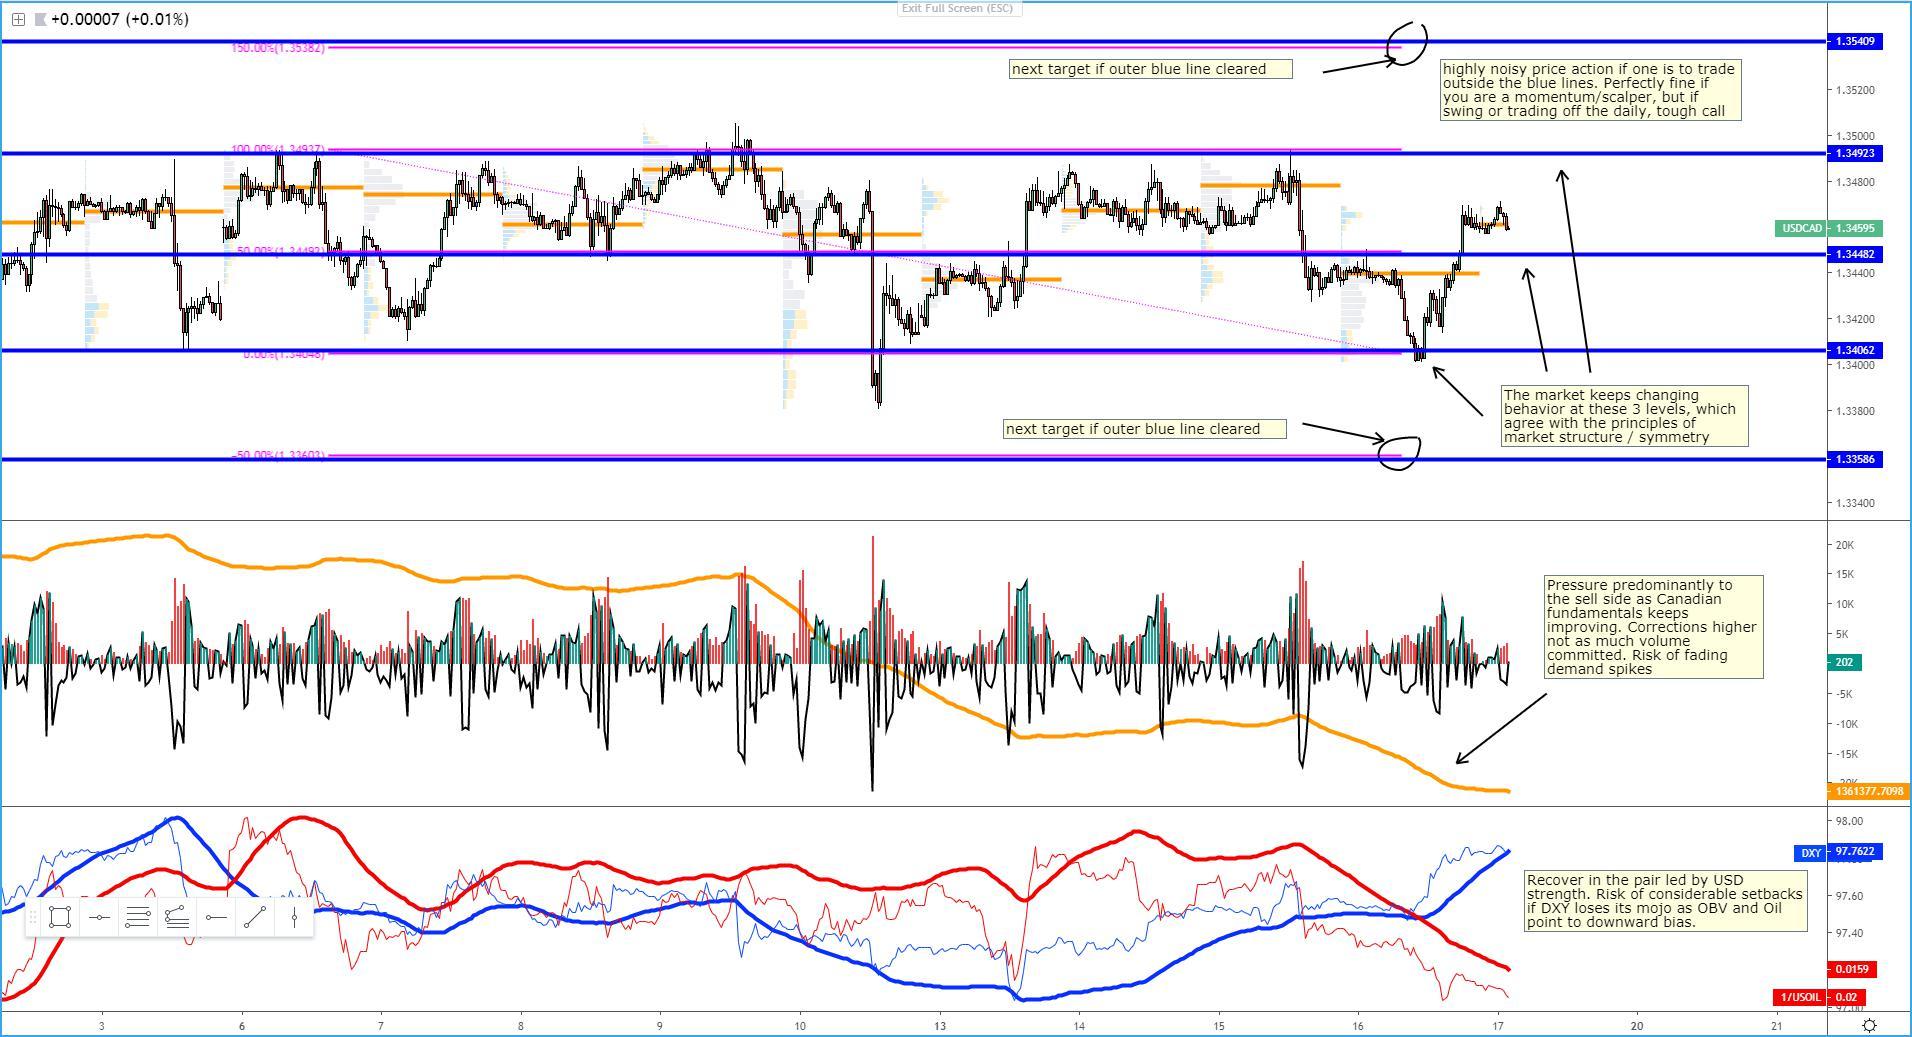
USD/CAD: Huge Area Of Resistance, Key Battlegrounds Defined
Important Footnotes
- Risk model: The fact that financial markets have become so intertwined and dynamic makes it essential to stay constantly in tune with market conditions and adapt to new environments. This prop model will assist you to gauge the context that you are trading so that you can significantly reduce the downside risks.
- Cycles: Markets evolve in cycles followed by a period of distribution and/or accumulation. The weekly cycles are highlighted in red, blue refers to the daily, while the black lines represent the hourly cycles.
- POC: It refers to the point of control. It represents the areas of most interest by trading volume and should act as walls of bids/offers that may result in price reversals. The volume profile analysis tracks trading activity over a specified time period at specified price levels. The study reveals the constant evolution of the market auction process.
- Tick Volume: Price updates activity provides great insights into the actual buy or sell-side commitment to be engaged into a specific directional movement. Studies validate that price updates (tick volume) are highly correlated to actual traded volume, with the correlation being very high, when looking at hourly data.
- Horizontal Support/Resistance: Unlike levels of dynamic support or resistance or more subjective measurements such as fibonacci retracements, pivot points, trendlines, or other forms of reactive areas, the horizontal lines of support and resistance are universal concepts used by the majority of market participants.
- Trendlines: Besides the horizontal lines, trendlines are helpful as a visual representation of the trend. The trendlines are drawn respecting a series of rules that determine the validation of a new cycle being created. Therefore, these trendline drawn in the chart hinge to a certain interpretation of market structures.
- Correlations: Each forex pair has a series of highly correlated assets to assess valuations. This type of study is called inter-market analysis and it involves scoping out anomalies in the ever-evolving global interconnectivity between equities, bonds, currencies, and commodities.
- Fundamentals: It’s important to highlight that the daily market outlook provided in this report is subject to the impact of the fundamental news. Any unexpected news may cause the price to behave erratically in the short term.
- Projection Targets: The usefulness of the 100% projection resides in the symmetry and harmonic relationships of market cycles. By drawing a 100% projection, you can anticipate the area in the chart where some type of pause and potential reversals in price is likely to occur, due to 1. The side in control of the cycle takes profits 2. Counter-trend positions are added by contrarian players 3.