
Bank of America Corporation (NYSE:BAC) and U.S. Bancorp (NYSE:USB) reported first-quarter earnings results on Apr 16 and Apr 18, respectively. While Bank of America’s first-quarter earnings per share and revenues outpaced their respective estimates, U.S. Bancorp managed to beat its bottom-line estimate by only a cent, while missing on the top line.
Both bank stocks have a Zacks Rank #3 (Hold). Now, let’s see which stock is better positioned in terms of fundamentals, post-earnings. You can see the complete list of today’s Zacks #1 Rank (Strong Buy) stocks here.
Other major earnings came from other big banks like The Goldman Sachs Group, Inc. (NYSE:GS) and JPMorgan Chase & Co. (NYSE:JPM) .
Q1 Earnings Performance
Bank of America’s first-quarter earnings of 62 cents per share outpaced the Zacks Consensus Estimate of 59 cents. Also, the figure was 38% higher than the prior-year quarter. Net quarterly revenues came in at $23.1 billion, beating the Zacks Consensus Estimate of $22.9 billion and increasing nearly 4% from the prior-year quarter. (Read More: BofA Tops Q1 Earnings on Higher Rates, Equity Trading)
Meanwhile, U.S. Bancorp’s first-quarter adjusted earnings per share of 95 cents surpassed the Zacks Consensus Estimate by only a penny. The figure did not show improvement from the prior-year quarter’s earnings of 82 cents. U.S. Bancorp’s net quarterly revenues of $5.5 billion lagged the Zacks Consensus Estimate of $5.53 billion. (Read More: U.S. Bancorp's Q1 Earnings Beat Estimates, Revenues Up)
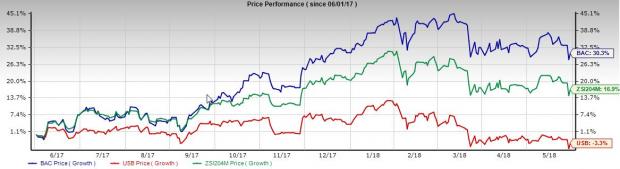
Price Performance
Bank of America has gained 30.3% in the past year and outperformed the broader industry that has moved up 16.9%. In comparison, U.S. Bancorp has not only underperformed the broader industry but also Bank of America, declining 3.3% over the same time frame.
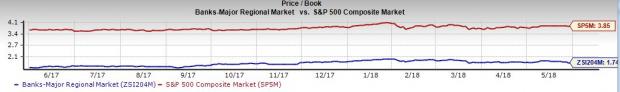
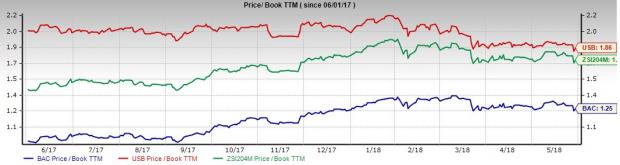
Valuation
Compared with the S&P 500, the industry is clearly undervalued. This implies that the industry has upside potential for the near future. The industry has an average trailing 12-month P/B ratio — which is the best multiple for valuing banks because of large variations in their earnings results from one quarter to the next — of 1.74, which is below the S&P 500’s average of 3.85. Hence, it might be a good idea to focus on stocks belonging to this particular industry post-earnings.
Coming to the two stocks under consideration, with a P/B ratio of 1.86 U.S. Bancorp is undervalued than the S&P 500 but overvalued than the industry. However, Bank of America with a P/B ratio of 1.25 is less pricey than both the S&P 500 and the industry.
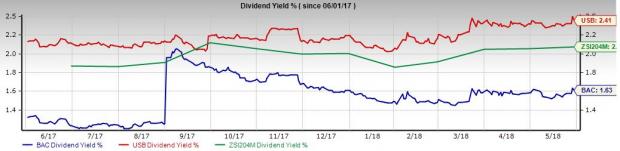
Dividend Yield
U.S. Bancorp’s dividend yield over the last year is 2.41%, higher than the broader industry’s figure of 2.11%. With a dividend yield of only 1.63%, Bank of America shareholders earn a comparatively lower dividend yield than both its smaller competitor and the broader industry.
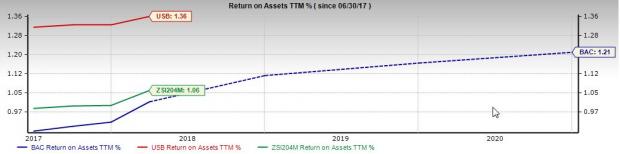
Return on Assets (ROA)
Return on assets (ROA) is one of the key financial ratios for banks as they rely heavily on their assets to create revenues. A positive ROA indicates that the company has reported gains from its assets for the period in question. Coming to U.S. Bancorp and Bank of America, ROA for the trailing 12-months (TTM) is 1.36% and 1.21%, respectively. U.S. Bancorp has a higher ROA than not only Bank of America, but also the industry, which has ROA of 1.06%.
Earnings History and Estimate Revisions
U.S. Bancorp delivered positive surprises in each of the last four quarters, with an average earnings surprise of 0.95%. In comparison, Bank of America delivered an earnings beat in all the trailing four quarters and delivered an average positive earnings surprise of 5.8%.
When considering estimate revisions, Bank of America’s earnings estimate for the current year has improved 2.8% over the last 60 days. Meanwhile, U.S. Bancorp’s earnings estimate has declined by 0.3% over the same period.
Conclusion
In our comparative analysis, we found that both the two big banks have certain positives. U.S. Bancorp has better ROA position and has a higher dividend yield. However, in terms of valuation, Bank of America is underpriced compared to U.S. Bancorp. Further, Bank of America has comparatively better price performance than U.S. Bancorp.
Moreover, Bank of America holds an edge over U.S. Bancorp when considering its average positive earnings surprise and estimate revisions. What clinches the case in favor of Bank of America at this point of time is that it has posted better earnings results than U.S. Bancorp. In this respect, our analysis clearly indicates that Bank of America is better positioned than U.S. Bancorp and thus calls for investors’ attention after earnings.
Will You Make a Fortune on the Shift to Electric Cars?
Here's another stock idea to consider. Much like petroleum 150 years ago, lithium power may soon shake the world, creating millionaires and reshaping geo-politics. Soon electric vehicles (EVs) may be cheaper than gas guzzlers. Some are already reaching 265 miles on a single charge.
With battery prices plummeting and charging stations set to multiply, one company stands out as the #1 stock to buy according to Zacks research.
It's not the one you think.
JPMorgan Chase & Co. (JPM): Free Stock Analysis Report
U.S. Bancorp (USB): Free Stock Analysis Report
Bank of America Corporation (BAC): Free Stock Analysis Report
The Goldman Sachs Group, Inc. (GS): Free Stock Analysis Report
Original post
Zacks Investment Research