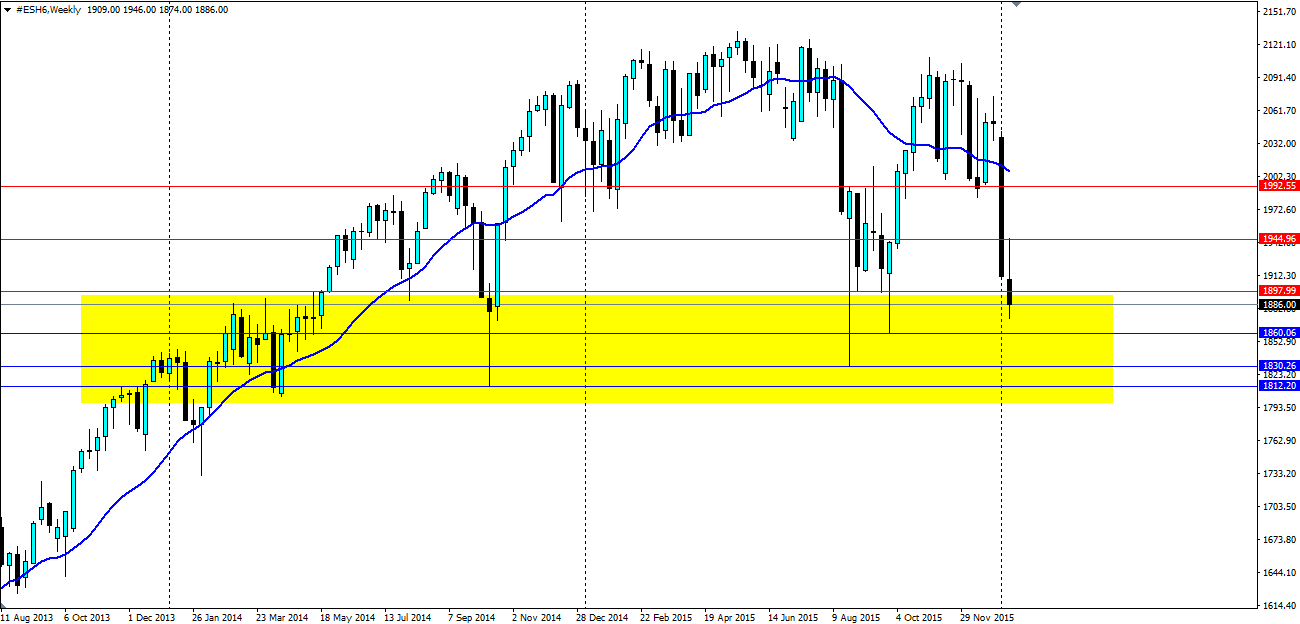
The poor start to 2016 has continued unabated with the S&P 500 shedding another 2.50% in yesterday’s trading. The index is now heading into a zone of support that has seen the index form swing points in the past. Will we see the same this time around?
The S&P 500 posted its worst ever start to a year, losing over 6% in the first week of trading. Earlier this week some minor gains were found which gave the market hope that the slide was coming to an end. But those hopes were dashed when the rout continued in trading yesterday as another 2.5% was given up, led by energy and banking stocks.
The markets have taken a risk off approach to 2016 as the selling in Chinese stock markets has caused carnage that threatens to spill over into global markets. There is serious concern that the slowdown in China will be a deep one which will have wide ranging effects that will be felt not only across the Asian region, but the entire global economy.
The turmoil comes at the worst time for the Federal Reserve, but their efforts to increase borrowing costs may in fact be a contributing factor. If the yield on safe haven assets such as treasury bills increases, the relative yield on equities reduces, this in turn reduces demand. The Fed is also contributing, with the Fed’s Beige Book pointing to a strong labour market but soft wage pressure, and falling estimates for US economic growth. The fear of a slowdown in the US is very real and we are seeing it play out on the equity markets.
Technicals may provide the index with some relief as we enter into a support zone. In late 2013 and early 2014, we saw the index hit fresh highs at 1,845 and 1,892 before pulling back sharply both times. Late 2014 saw a deep pullback through these levels to as low as 1,812 before it continued on to further record highs. A year later and the sharp selling on the Chinese market saw a very rapid pullback in the S&P 500 to the 1,830 mark where it found support. Another swing candle formed at 1,860 before price returned close to the previous record highs (but crucially did not break them).

The current bearish shift has nudged its way into the support zone highlighted on the above weekly chart for S&P 500 futures. Watch for the formation of any reversal pattern on the lower timeframe charts as this could indicate the bulls have come to the party. Any hint of a reversal will be met with strong buying and short covering which traditionally has been just as swift as the selloffs. If we break through all support levels and below the zone, I would be very concerned.
