
The US stock markets have steadily climbed since the 2008 financial crisis, achieving a remarkable 740% growth between 2009 and 2024. This upward trajectory, while occasionally disrupted by events like COVID-19 and the Ukraine War, has consistently rebounded, defying recession predictions and showcasing market resilience.
The S&P 500’s performance since 2008 is illustrated in the chart below, highlighting some of key events that potentially impacted the market. Despite these events, the upward trend has persisted through various political administrations, fiscal policies, and fluctuating interest rates.

Source: Tradingview.com
The Equity markets in general are driven by multiple different factors, some of the main drivers are a sector’s performance, company’s earnings, potential future growth, how much investors value a stock and are willing to pay for it. However, businesses need a friendly economic environment to thrive, and the overall health of the US economy can have a major impact on businesses which is then reflected onto the stock market indices such as the S&P 500.
What are some of the key economic indicators to gauge the health of the US economy?
By monitoring these indicators, market participants can gain a better understanding of the economy’s current state and potential future direction, which helps them make informed investment decisions.
Inflation
Inflation is the general increase in the prices of goods and services over a period of time, higher inflation reduces the spending power of a currency over the long term and can significantly impact economic growth.
- Firstly, when inflation is high, businesses often face higher interest rates on loans. This is because lenders typically adjust interest rates to reflect the increasing cost of living. Higher interest rates make it more expensive for businesses to borrow money, which can limit their ability to invest in new projects, expand operations, or hire more employees. As a result, businesses may experience slower growth or even be forced to scale back their operations.
- Secondly, inflation also affects consumer spending. When prices rise, consumers may have less disposable income as a larger portion of their budget goes toward essential expenses such as housing, food, and transportation. This can lead to consumers becoming more selective with their spending, opting for cheaper alternatives or postponing non-essential purchases. As a result, businesses that rely on consumer spending may experience a decline in sales and revenue, further impacting overall economic growth.
- Additionally, inflation can disrupt long-term planning and investment decisions, as businesses and individuals become more uncertain about the future value of money. This uncertainty can lead to a reluctance to commit to major projects or investments, further slowing down economic growth.
- Therefore, policymakers and central banks often prioritize controlling inflation to maintain stable economic conditions and foster sustainable growth. Measures such as raising interest rates, adjusting monetary policies, and implementing targeted interventions may be employed to curb inflation and mitigate its negative effects on businesses and consumer spending.
In the US, the Federal Reserve’s inflation target rate is 2%, this percentage can stimulate spending which keeps the economy growing. However, if inflation is higher than wage growth, it can be a sign of a struggling economy.
The US Consumer Price Index is an economic indicator that measures inflation in the US, it measures the average change over time in the prices paid by urban consumers for a market basket of consumer goods and services. The indicator comes in different forms, the Core CPI provides data that excludes volatile components like energy and food products. Other inflation indicators are also watched closely by traders such as Core Personal Consumption Expenditure (Core PCE) , the FED’s preferred inflation gauge.

Source: Bloomberg Terminal
As indicated on the above chart, the US CPI has been fluctuating around the 2% level from 2008 till early 2021, in some cases, it was as low as -2.0% and as high as 5.0%, mostly affected by the impact of the 2008 financial crisis as well as the sharp swings in energy prices, however, the Core CPI and Core PCE remained stable around the 2.0% level for the same period.
Following the COVID19 Pandemic, global inflation rose significantly, CPI reached 9.1%, Core CPI 6.6% and Core PCE 5.6%. In March of 2022, the Federal Reserve raised interest rates for the first time since 2018 and continued its interest rate hike path up to 5.25% – 5.5% range. The US CPI is currently at 3.4%, Core CPI at 2.9% and Core PCE at 2.6%
As inflation began and continued to decline over the past 2 years. The FED pivoted in December of 2023, stopped raising rates and kept the markets on hold anticipating the FED’s first rate cut which took place on September 18th, 2024 when the FED cut interest rates by 50 basis points, setting the current FED Funds Rate at the range of 4.75% – 5.0%.
According to Bloomberg’s Analysts surveys, economists see US Inflation reaching the Federal Reserve’s target early next year, the surveys show that the PCE gauge averaging 2.1% in early 2025.
Job Market Data
Job market data includes employment figures and unemployment rates, which indicate the strength of the labor market and the overall economic health. Traders in general pay attention to Non-Farm Payrolls and Unemployment Rate.
The Non-Farm Payrolls (NFP) is a key economic indicator that measures the number of jobs added or lost in the US economy, excluding the farming sector. Following the spikes in job numbers caused by COVID19, the Non-Farm payroll figures continued to beat expectations over the past few years, reflecting the strength of the US economy as more jobs were added. However, the number of added jobs has recently stabilized, sending warnings of a potential slow down.
The Unemployment Rate currently hovers around 4.1%, its latest reading for September 2024. Over the past few years, and as the world was getting out of COVID restrictions, the unemployment rate in the USA declined to some of its historic lowest levels reaching 3.4%, reflecting the strength of the US economy and supporting a slower FED in its rate cut path.
FOMC – Monetary Policy and Interest Rates
The Federal Reserve’s interest rate policy affects the US economy by influencing borrowing costs, spending, and investment. Lower interest rates encourage borrowing and spending, stimulating economic growth. Conversely, higher interest rates can slow the economy by making borrowing more expensive. The Federal Reserve uses its interest rate policy to manage inflation and promote economic stability.
The FED, same as other global central banks, have said multiple times that any interest rate decisions will be data dependent, and that the FED continues to monitor the markets closely, aiming to keep inflation under control within a sustained economic growth environment.

Source: CME Group
The next upcoming FED meetings for 2024 and early 2025 are scheduled for November 7th, 2024, December 18th, 2024 and January 29th, 2024. According to the most recent review of the CME FedWatch tool, market participants still anticipate an average of three x 25 basis point interest rate cuts between November 7th, 2024, and January 29th, 2025, however, at lesser percentages than seen in prior weeks. For the November 7th, 2024, meeting, the percentage of participants expecting a 25-basis point rate cut stands at 93.0%, while those expecting rates to remain on hold stands at 7.0%. As for the December 18th, 2024, Fed’s meeting, the percentage of a further 25-basis points rate cut currently stands at 69.8%.
What are the potential risks facing the US stock market in the current market environment?
Some examples of the potential risks may include but are not limited to:
- Interest Rate Uncertainty: The market is divided on future Fed rate cuts, causing uncertainty and potential volatility.
- Economic Data Sensitivity: Upcoming data releases could cause market reactions if they deviate from expectations.
- Political Pressure: The US elections risk, and the fact that some politicians were calling for more aggressive rate cuts, which could influence the market sentiment around the FED decisions.
- Global Factors: The potential impact of global events on the US stock market.
Remember, these are just some potential challenges. The market is constantly influenced by a wide range of other major factors such as companies earnings, growth as well as many other factors.
Technical Analysis SPX500 Weekly Chart
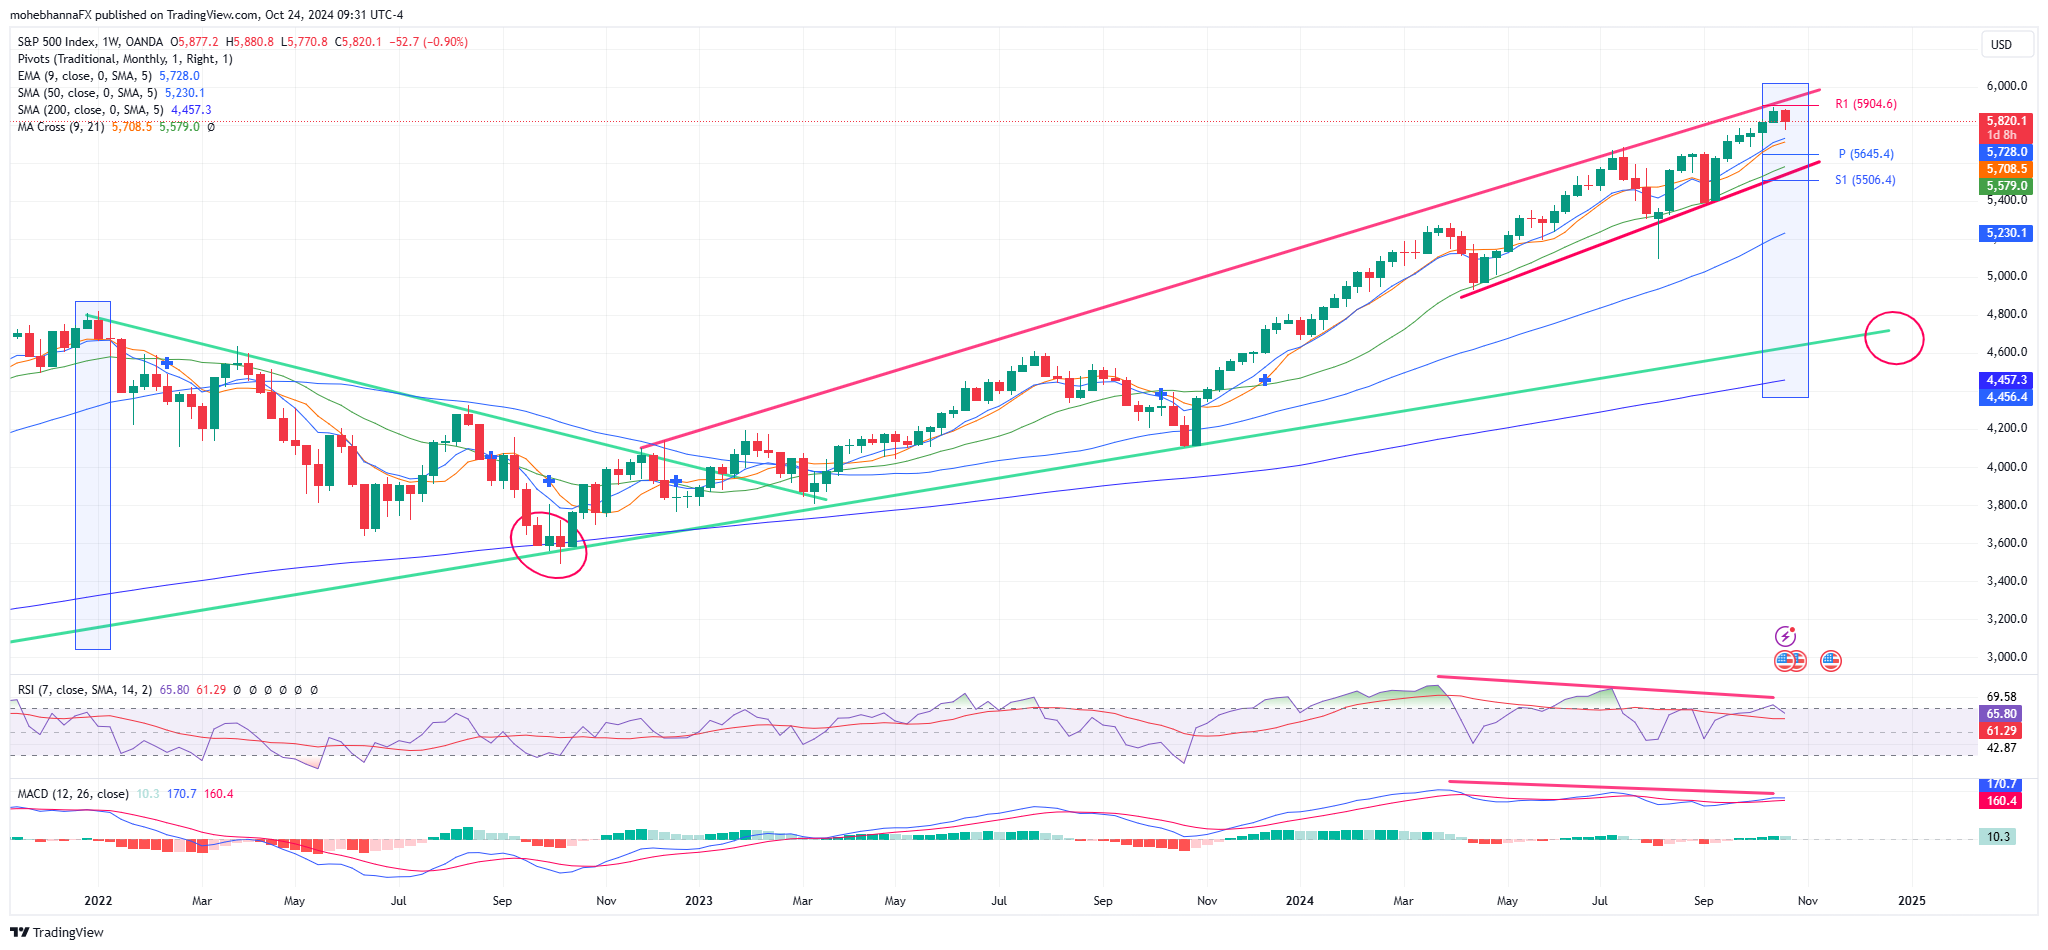
Source: Tradingview.com
- As previously mentioned, the S&P 500 Index has been in an uptrend since the markets got out of the financial crisis in 2008, the long term uptrend faced multiple hiccups along the way, however, the index was able to resume its uptrend reaching historic highs.
- The MACD indicator reflects that the price action deviation from its moving averages has remained near its widest points for an extended period, and currently has a negative divergence to price action for the later part of the uptrend, suggesting weakness in the ongoing trend, marked by the red lines. The MACD line remains above the signal line, however, it is yet to break below it.
- Price action is currently finding resistance along its Monthly R1 standard calculation of 5904, a weekly close price near the 5780 area, will complete a bearish engulfing candle on the weekly timeframe.
- A confluence of support lies below the price, represented by the EMA9 and the SMA9 intersecting with the monthly pivot point 5645.4, a second confluence of support lies below, represented by the SMA21, the redline lower channel border and the monthly S1 standard calculation of 5506.4.
Market Sentiment – COT

Source: cotbase.com
The COT report for the week ending on Friday, October 18th, 2024 (Includes data up to the end of day Tuesday, October 15th, 2024) reflects the following:
- Asset Manager/Institutional position levels have been in line with price action since early 2020 (Blue lines). However, as the long position level historic extremes were reached, a negative divergence can be seen between price action and Asset Manager/Institutional positions. Price action is making higher highs, while Asset Manager/Institutional’ long positions are making lower highs (Red lines), suggesting a potential change in sentiment.
- The latest COT report also reflects a discrepancy, the positions data reflects that Other Reportables are moving towards sell while the Small Speculators category are moving towards long.
In conclusion, the US stock market’s future trajectory is contingent upon a multitude of factors, including economic indicators, Federal Reserve policy, and global events. While the market has demonstrated resilience in the face of past challenges, investors must remain vigilant and adaptable in this evolving landscape. By carefully considering economic data, technical analysis, and market sentiment, investors can position themselves to navigate the next chapter of the US stock market with greater confidence.