⭐ Start off 2025 with a powerful boost to your portfolio: January’s freshest AI-picked stocksUnlock stocks

U.S. Stock And Sector Performance Heatmaps

Published 03/01/2020, 02:53 AM
Updated 07/09/2023, 06:31 AM
US500
-
DJI
-
XLE
-
XLF
-
XLK
-

The following percentage graph shows a 1-year comparison of the S&P 500 Index with the S&P Sectors. You can see which Sectors are outperforming or underperforming the Index.
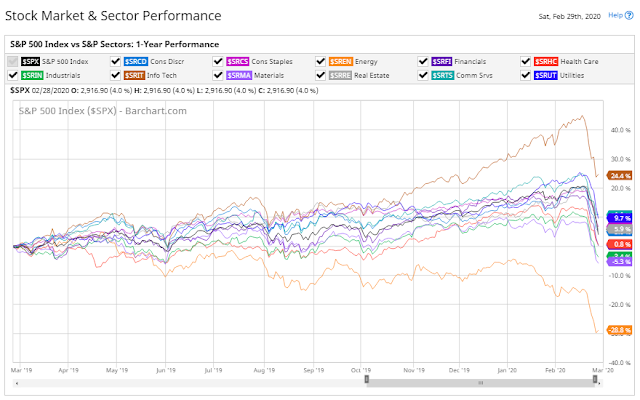
Stock Market & Sector Performance

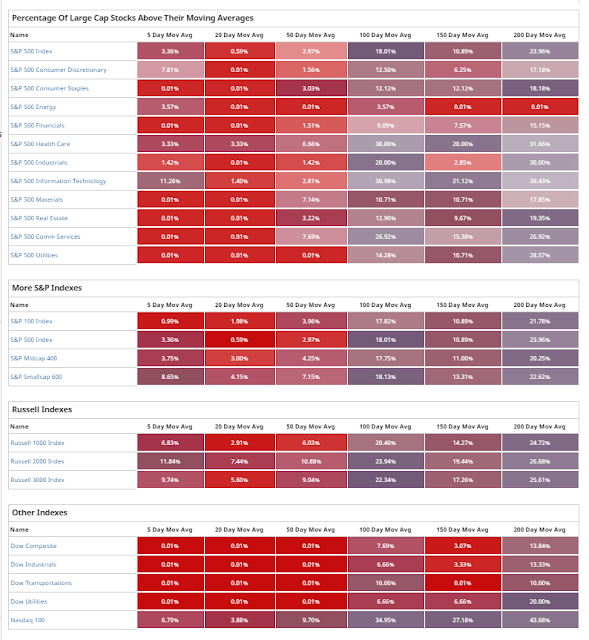
The following heatmap shows the percentages of stocks within the Sectors and Major U.S. Indices that are currently trading above a variety of moving averages, as of Friday's close.

You can quickly see which are the weakest and strongest of the weak (especially after last week's record market purge) by which ones have the most/least stocks above their 200-day moving average.

With regard to the Major Indices, the Nasdaq 100 is the strongest, while the Dow Transports are the weakest.
Major Indices

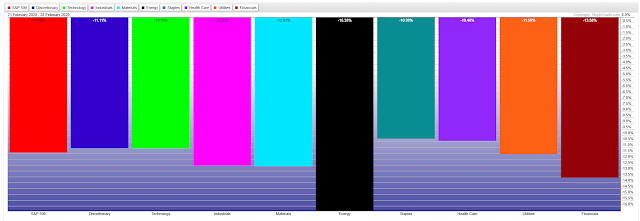
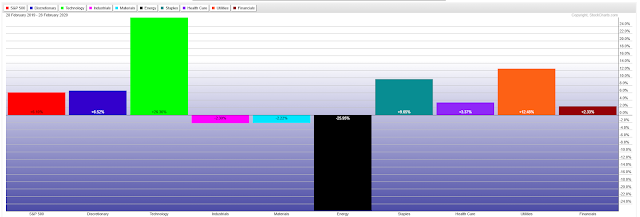
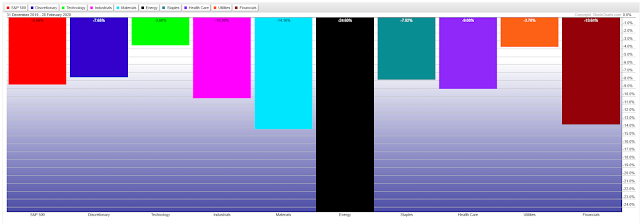
The following percentages gained/lost graphs of the S&P 500 Index and the 9 Major Sectors are provided by Stockcharts.com.

The timeframe on each of them is one year, year-to-date, and last week, respectively.

You can see that Technology is outperforming Energy on all three timeframes, while Financials aren't looking too healthy. That is confirmed on the heatmap above...check out the percentages of their stocks above their 200-day moving average.
Sectors Chart
Sectors Chart
Sectors Chart

BOTTOM LINE:

There are no Sectors or Major Indices with stocks that are in the green above their shortest moving average, namely their 5-day moving average, on the heatmap.

Generally speaking, if Friday's bounce continues into this coming week, we may see that flip at some point. If that happens and fails to hold, look for a further equity selloff. Otherwise, we may see them rally to their 20-day moving average before they, either continue convincingly, or reverse around that area of resistance for another leg down to, potentially, new lows.

Latest comments

Loading next article…
Risk Disclosure: Trading in financial instruments and/or cryptocurrencies involves high risks including the risk of losing some, or all, of your investment amount, and may not be suitable for all investors. Prices of cryptocurrencies are extremely volatile and may be affected by external factors such as financial, regulatory or political events. Trading on margin increases the financial risks.
Before deciding to trade in financial instrument or cryptocurrencies you should be fully informed of the risks and costs associated with trading the financial markets, carefully consider your investment objectives, level of experience, and risk appetite, and seek professional advice where needed.
Fusion Media would like to remind you that the data contained in this website is not necessarily real-time nor accurate. The data and prices on the website are not necessarily provided by any market or exchange, but may be provided by market makers, and so prices may not be accurate and may differ from the actual price at any given market, meaning prices are indicative and not appropriate for trading purposes. Fusion Media and any provider of the data contained in this website will not accept liability for any loss or damage as a result of your trading, or your reliance on the information contained within this website.
It is prohibited to use, store, reproduce, display, modify, transmit or distribute the data contained in this website without the explicit prior written permission of Fusion Media and/or the data provider. All intellectual property rights are reserved by the providers and/or the exchange providing the data contained in this website.
Fusion Media may be compensated by the advertisers that appear on the website, based on your interaction with the advertisements or advertisers.
© 2007-2025 - Fusion Media Limited. All Rights Reserved.