March 8th, 2016
In an earlier article, I had posed the question if soybean oil was staged for a bull or bear run. I believe that the market is continuing to stage itself for a bear run.
Bottom Line
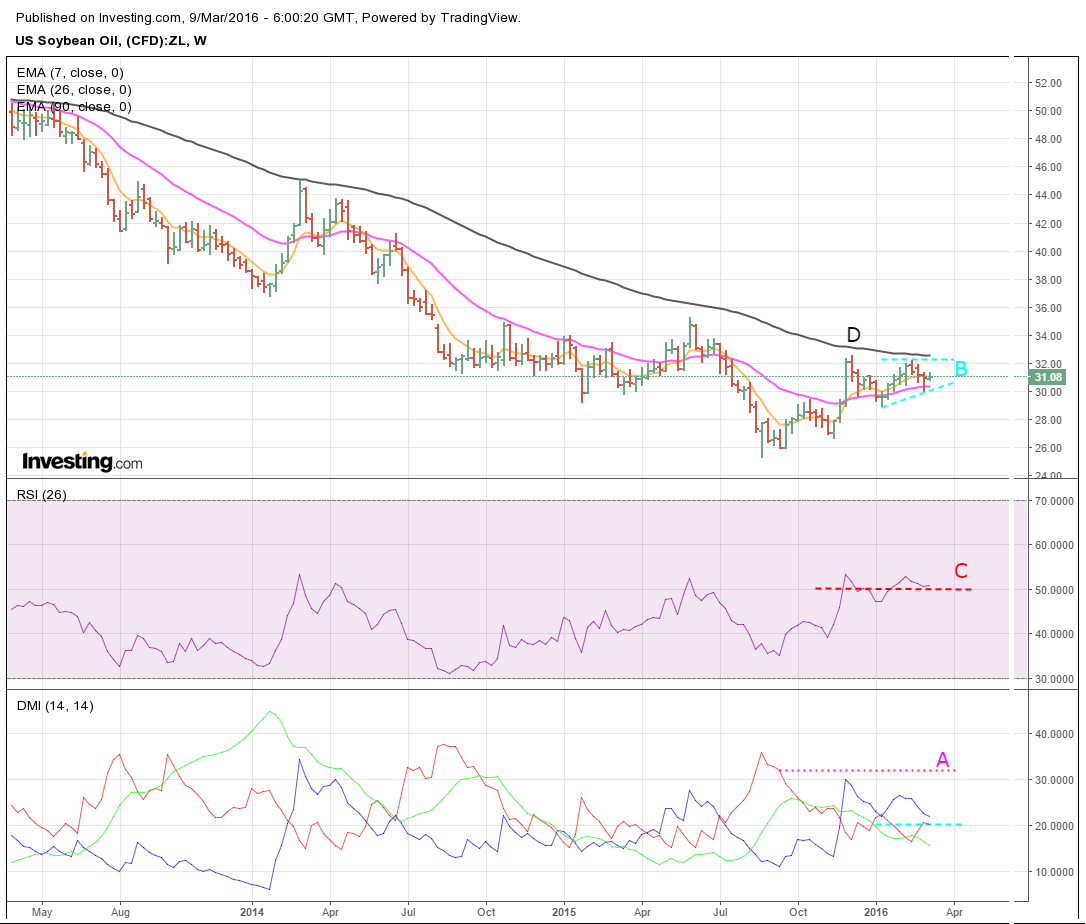
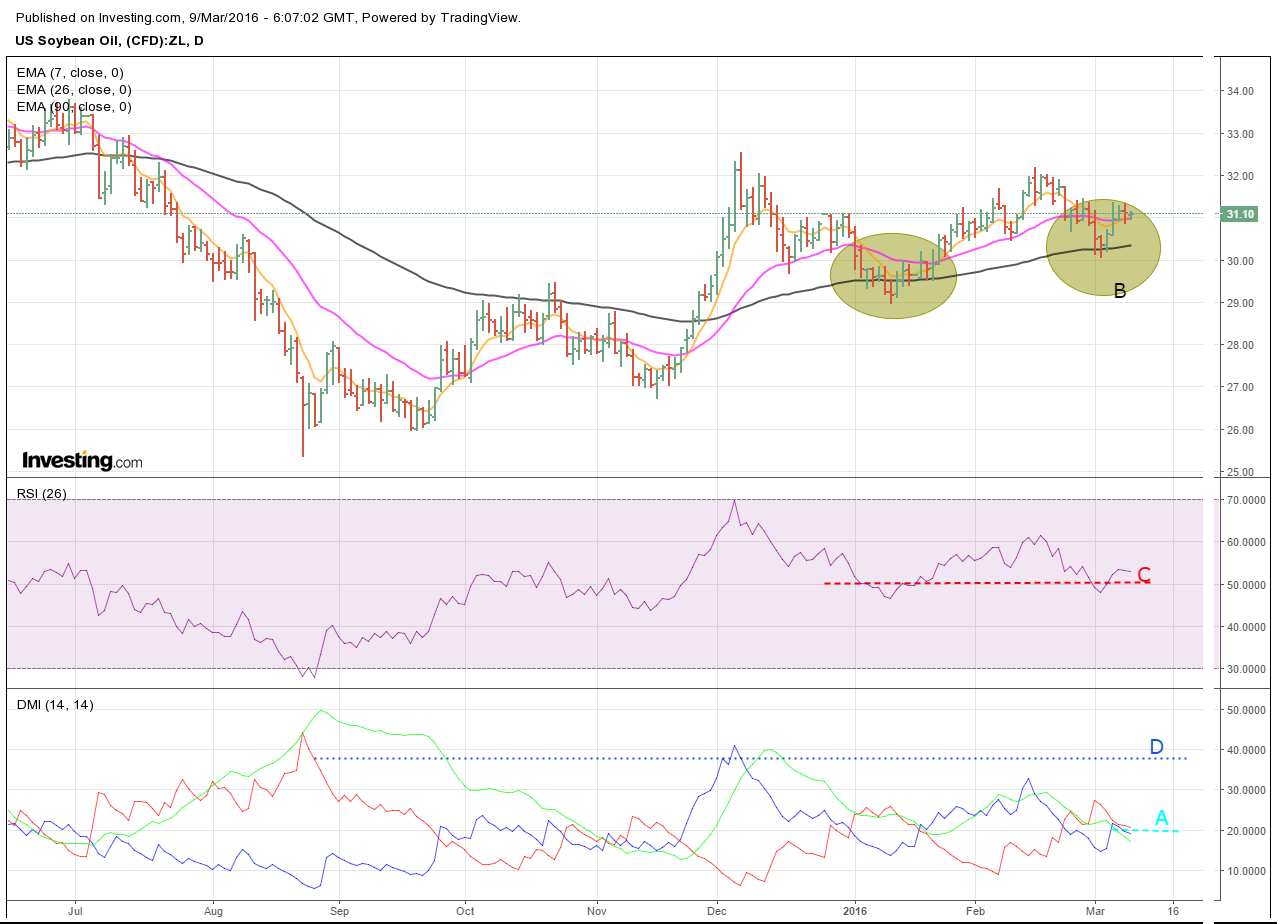
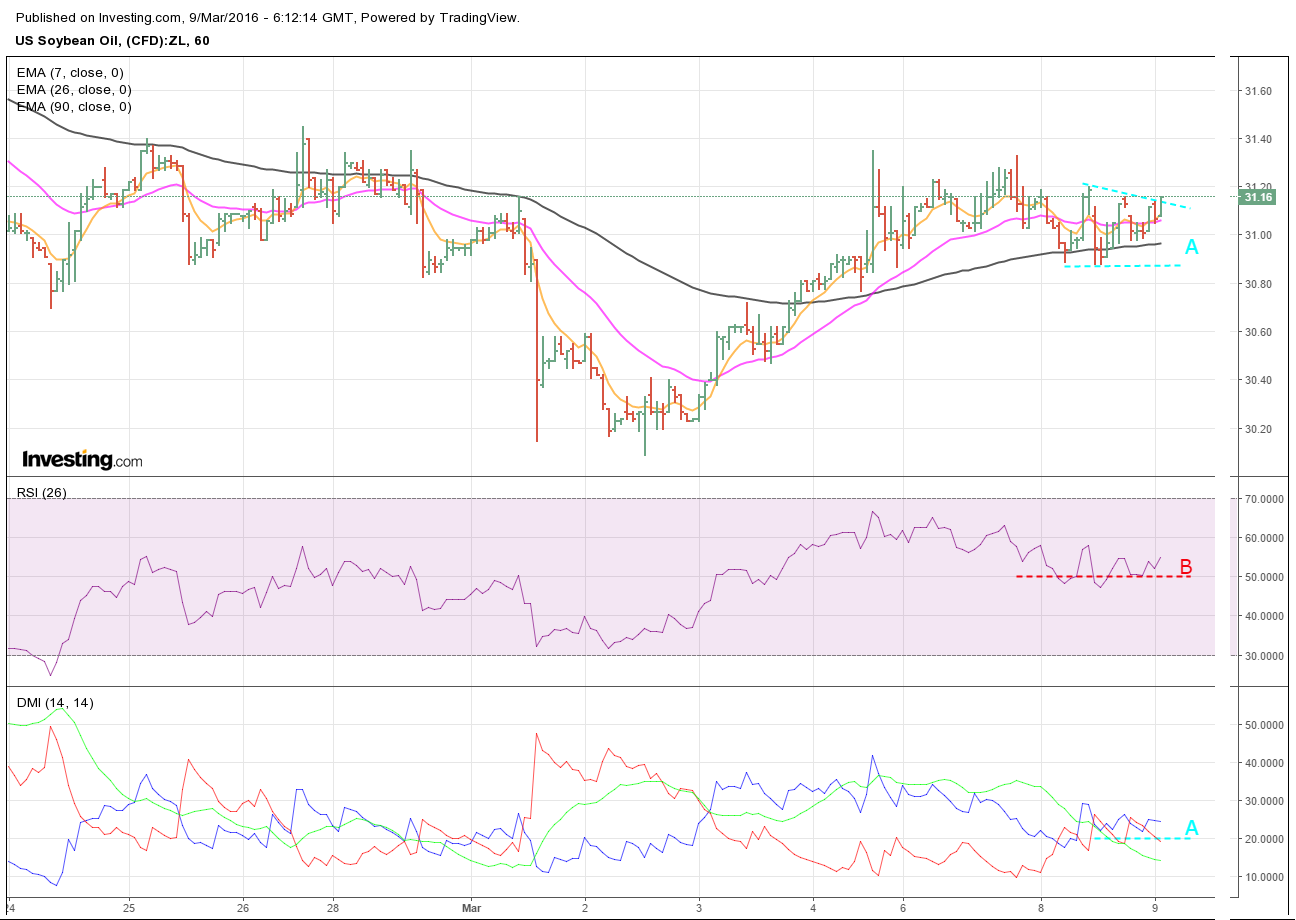
The market continues to push hard on the 90-period EMA on the weekly chart. In addition to holding price, this line is holding the 7 and 26-period EMA. Furthermore, the daily and hourly ADX has joined the weekly chart’s ADX in dropping below 20 and/or the +/-DI. With all three charts entering or maintaining this consolidation pattern, price should stay confined to the ranges but ready to breakout sharply. My belief is that it will be to the down side.
The Weekly Chart 
- The -DI that corresponds to the low in price in August has not been taken out by the +DI (A). This implies that the price action from the late August 2015 low has been that of a correction and not a first leg in a bull market
- The recent ADX has dropped below 20 and/or the +/-DI indicating a period of consolidation (B)
- The 26-period RSI has fluctuated in the 45-55 range which is neutral to direction (C)
- The 90-period EMA has held several challenges during past 2 years and is now being challenged repeatedly (D) but continues to hold
The Daily Chart 
- At a micro level, the -DI peak that corresponds to the low in price from late August continues to hold and has not been taken out by the +DI (D)
- From a continuation of the correction perspective, the 90-period EMA continues to hold the 7 and 26-period EMA along with price (B).
- The 26-period RSI continues to bounce off of the 50 range so upside support is still there (C)
- The recent ADX activity has now dropped below 20 and/or the +/-DI indicating consolidation in price (A)
The Hourly Chart 
- The ADX has dropped below 20 and/or the +/-DI (A)
- The 50 range on the 26-period RSI is providing support (B)
- The 90-period EMA has recently held the 7 and 26-period EMA along with price
What to Watch
Weekly/Daily/Hourly
- This market has reached a tipping point, with indicators aligning across three charts of different time frames
- Close attention to price and 90-period EMA along with 7 and 26-period for a bounce off 90 and a collective downturn across all charts
- Break below 50 on 26-period RSI and hold
- Price breakout below support lines that have been drawn
A breakout to the downside across charts in unison should signal a continuation of the bear run. One should hold off on entry until a pullback is in play where the current support levels become the resistance.
