Investing.com’s stocks of the week
Is the US soybean oil market staged for a bull or bear run?
From the low of August 26th, the market appears to be in what appears to be a corrective pattern. Or, one could argue that it is in the early phases of a bull run. Searching #beanoil will provide arguments for both sides.
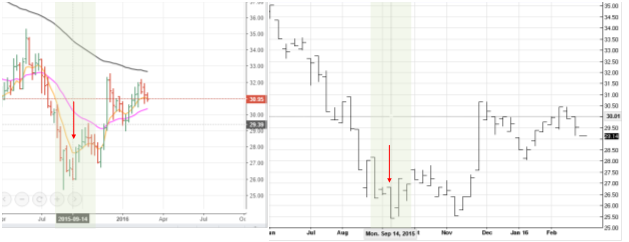
The low made in September in the cash market was not reflected in the futures market:

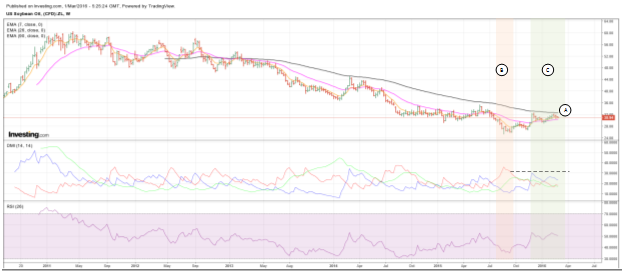
Looking at the weekly chart:

The weekly futures price is running into resistance of the 90 period EMA (A).
The ADX achieved on the week of the low price has not been taken out by the ensuing ADX corresponding to the price action since the low (B, C).
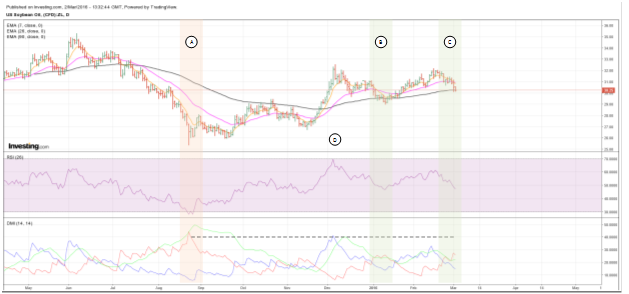
From the daily chart:

Even though the low made in September appears to be a failure when compared to the cash price, the ADX put in on that day has not been taken out, though it may have been briefly touched (A).
The 26 period RSI reached 70 on the December 7th high and this is the date that the ADX pulled into the range of the September low (D).
After the December high, prices have continued to bounce off the 90 period EMA while neither the ADX/DMI or the RSI breaking though previous resistance (B, C).
Summary:
Taking into consideration the above charts, it looks possible that the correction from the September low is hitting its final stages and that a bull market is less likely than a bear.
