
The Sept US ISM non-manufacturing index came at 52.6 vs 55.0 expected, which marks a 3-year low for the index as fears of contagion from a recessionary outlook in manufacturing spilling over into the services industry keep increasing. Amid this scenario, it's no wonder that long bets in the USD have evaporated this week...
The Daily Edge is authored by Ivan Delgado, Market Insights Commentator at Global Prime. The purpose of this content is to provide an assessment of the market conditions. The report takes an in-depth look of market dynamics, factoring in fundamentals, technicals, inter-market in order to determine daily biases and assist one’s decisions on a regular basis. Feel free to follow Ivan on Twitter & Youtube.
Quick Take
This week's back-to-back disappointments in the US ISM prints, both the manufacturing and services, have swiftly shifted the narrative from a Fed thought to be firmly sidelined this October to a rapid build up of expectations for the Central Bank to ease again when they meet in Oct 31st. A lot still can happen until then but that's where we are at today, with the chances of a 25bp rate cut almost fully priced in (~90%). Amid this scenario, it's no wonder that long bets in the USD have evaporated this week, with the CAD mark-down phase even more dramatic, partly due to the strong correlation between the two North American currencies, which also plays into the view that sooner or later, the Canadian economy will be hit by the slowdown in the US, which will force the BOC to ease policy in line with the global theme we are seeing. The AUD and the NZD were surprisingly strong once again, as it the market suddenly found comfort in short-term long plays as an alternative option amid the debacle of the two darlings of the Forex market until this week, referring to the USD and CAD, both at fresh yearly highs prior to Tuesday's onset of the epic rollover. Meanwhile, the Euro found renewed selling pressure off the highlighted hourly resistance in what should be considered as a very choppy day, with the Sterling attracting solid bids as UK PM Irish border proposal gets assessed by the EU and the Irish government, with not yet an official rejection. Lastly, the Yen held firm as one of the main beneficiaries of the woes in the US PMIs, while the Swiss Franc has gone through a whole different phase, depressed ever since the major miss in Switzerland's CPI on Wednesday, raising the alarm bells of lower rates by the SNB.
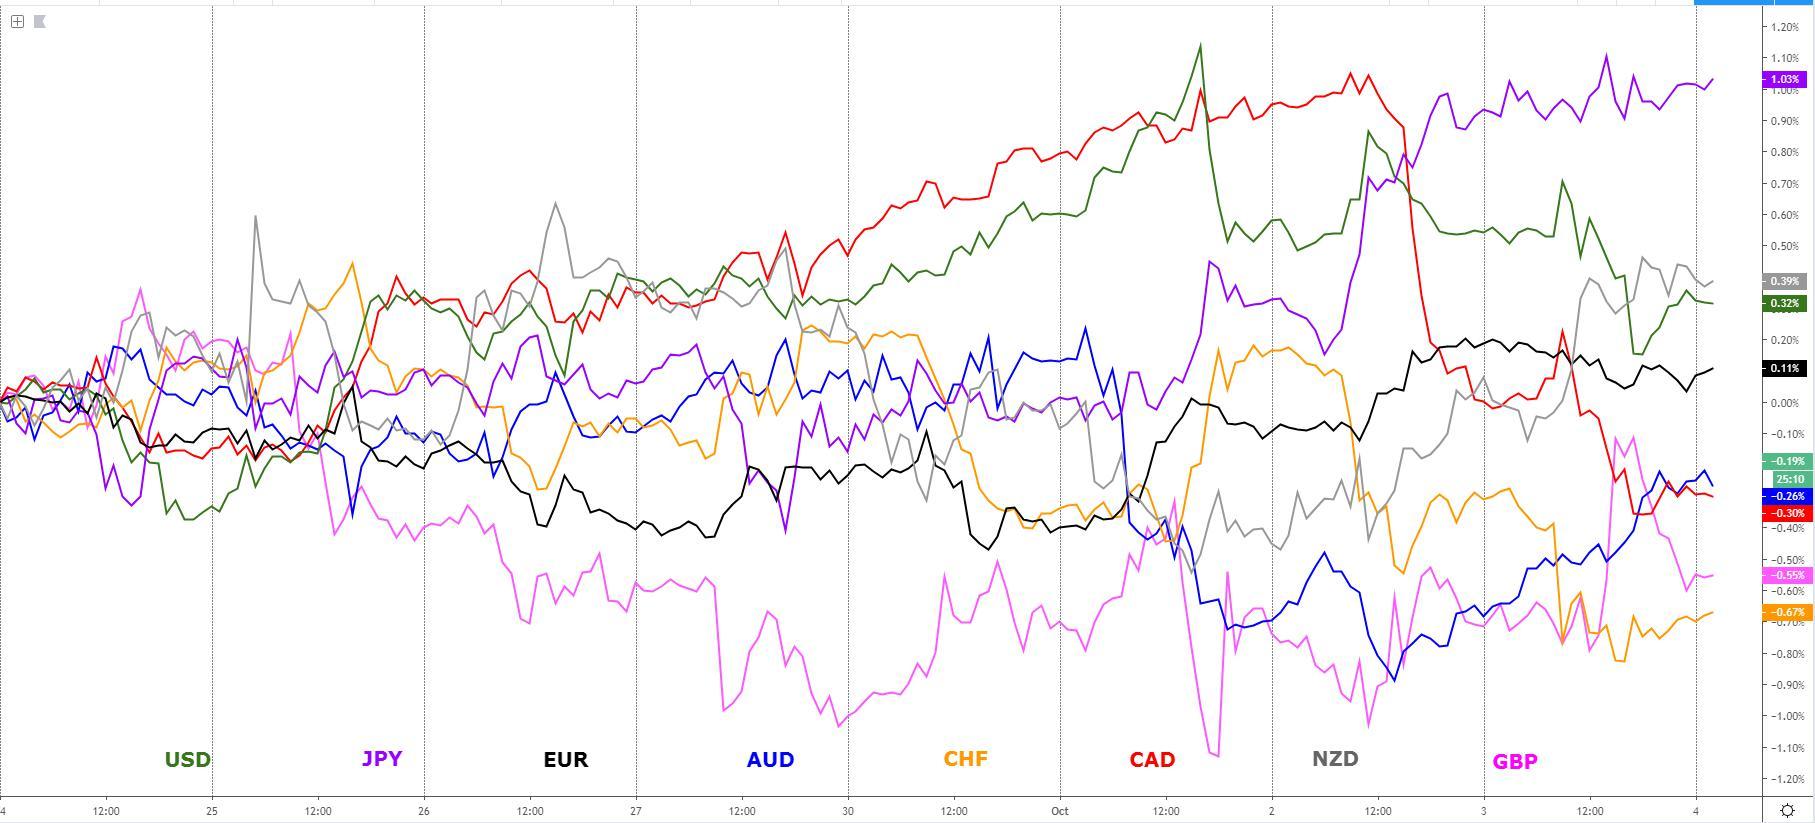
The indices show the performance of a particular currency vs G8 FX. An educational video on how to interpret these indices can be found in the Global Prime's Research section.
Narratives In Financial Markets
* The Information is gathered after scanning top publications including the FT, WSJ, Reuters, Bloomberg, ForexLive, Institutional Bank Research reports.
US services PMI at 3-year low: The Sept US ISM non-manufacturing index came at 52.6 vs 55.0 expected, which marks a 3-year low for the index as fears of contagion from a recessionary outlook in manufacturing spilling over into the services industry keep increasing. The services sector going downhill with the manufacturing is a much bigger deal as it accounts for nearly 90% of the US economy.
Weaker US NFP into year-end? The key focus for today is firmly anchored towards the US jobs report, expected to come at 140k as per the median forecasts. What’s alarming, as part of the miss on Thursday’s US ISM non-manuf PMI, is the plummeting of the employment sub-index to 50.4 from 53.1, which implies that a potential downtrend in payrolls growth may evolve.
Equities price in more easing by the Fed: Unlike the drop in equities on the back of Tuesday’s miss in the US ISM Manuf PMI, this time, US equities managed to withstand the initial shock with bids returning at the lows, with the heavyweight S&P 500 closing up 0.8%. The rationale at play here is that the poorer the US data, the more chances that the Fed will ease policy further, and that’s music to the ears of equity bulls. After today’s US ISM non-manuf miss, the market is pricing 43bp of cuts before year-end, and a 25bp cut in October 30th is almost fully priced in.
Woes in EU manufacturing feeds into services: More poor economic data out of the Eurozone was revealed on Thursday, this time it was the final services PMIs coming surprisingly lower than the ‘flash’ estimates, which essentially tell us, as in the case of the US, that the manufacturing contagion spillover is feeding into services. In France, the services PMI came at a 5 month low, in Germany it stands at the lowest it’s been in over 3 years, in Spain the sub-component of outlook is at a 5-year low just to name a few.
UK PM's Irish backstop proposal faces challenges: In the UK, the fact that the UK government’s latest Brexit proposals related to the Irish backstop were not immediately rejected by neither the Irish government nor the European Union, continues to play in favor of the Pound, even if flows are far from committed at this stage. The retracement of most gains by the end of business in NY reflects a market that still sees the proposal as a positive step but as part of a glass half full only. The reason is because Ireland still reportedly said there are “huge issues”, while the EU President Tusk told Boris Johnson, “we remain open but still unconvinced”, echoing similar concerns by EC President Juncker, who said “a number of problematic points remain in the proposal, with further work needed by the UK.”
Clarida a non-event speech to start Friday: Richard Clarida, Vice Chairman of the Federal Reserve, didn’t provide much to chew on as part of a speech in the early hours of Asia this Friday. The policymaker said “slowing global economy has hit US economy even if the US economy is still in good shape.” He nonetheless, reiterated that the Fed is not in “a pre-set course”, and that it will “act as appropriate.” Lastly, Clarida mentioned that “uncertainty about trade policy is impacting investment.” Bottom line, Clarida stuck to the script with no deviation whatsoever, reflected in a quiet USD during the speech.
Fed's Powell due on Friday: It’s important to be reminded that Friday also sees Fed Chair Powell speaking in an appearance billed as 'opening remarks' at a Fed event. Powell commences at 1800GMT. If having USD exposure heading into the weekend, you might want to re-assess that given the potential vol.
Australian retail sales eyed: In Asia today, the focus is on the AU retail sales, which comes after a poor showing in July. According to the Strategy Team at NAB, “we expect a modest rebound in August with the NAB cashless retail sales series pointing to a 0.3% gain (consensus: 0.5%). This is a small rise given that the tax office has said that an extra $3.2b worth of net refunds had been paid in the 9 weeks to 3 September, relative to the previous year. We are mindful of the uncertainty around our estimate, with the risk that sales could be stronger, although the RBA minutes reported that ‘liaison with retailers suggested that [the tax cuts] had yet to lift spending noticeably’.”
Recent Economic Indicators & Events Ahead
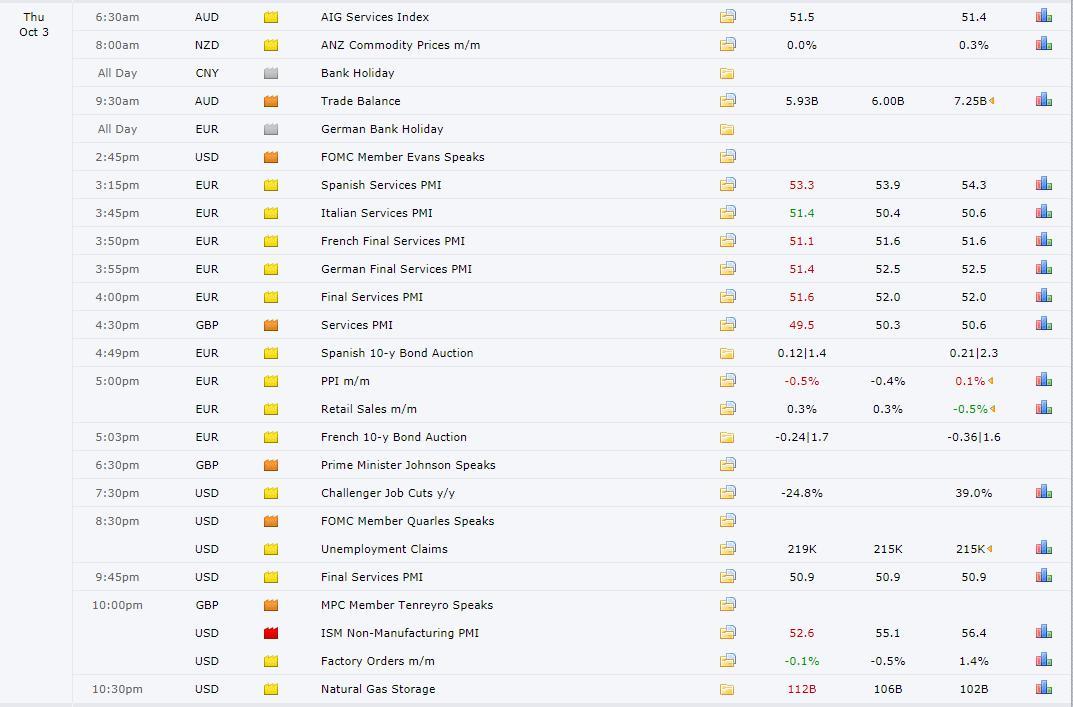
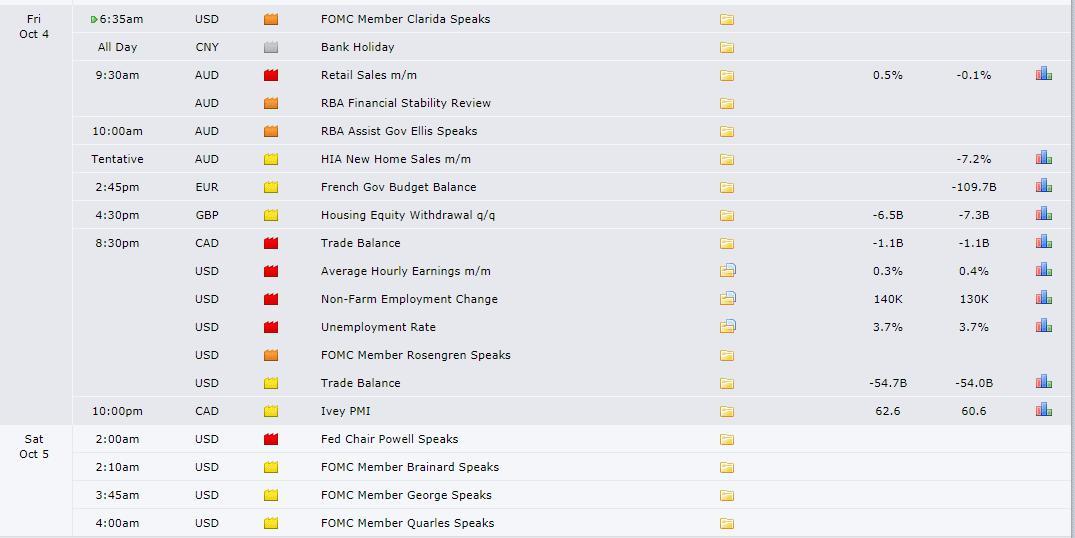
Source: Forexfactory
A Dive Into The FX Indices Charts
The indices show the performance of a particular currency vs G8 FX. An educational video on how to interpret these indices can be found in the Global Prime's Research section.
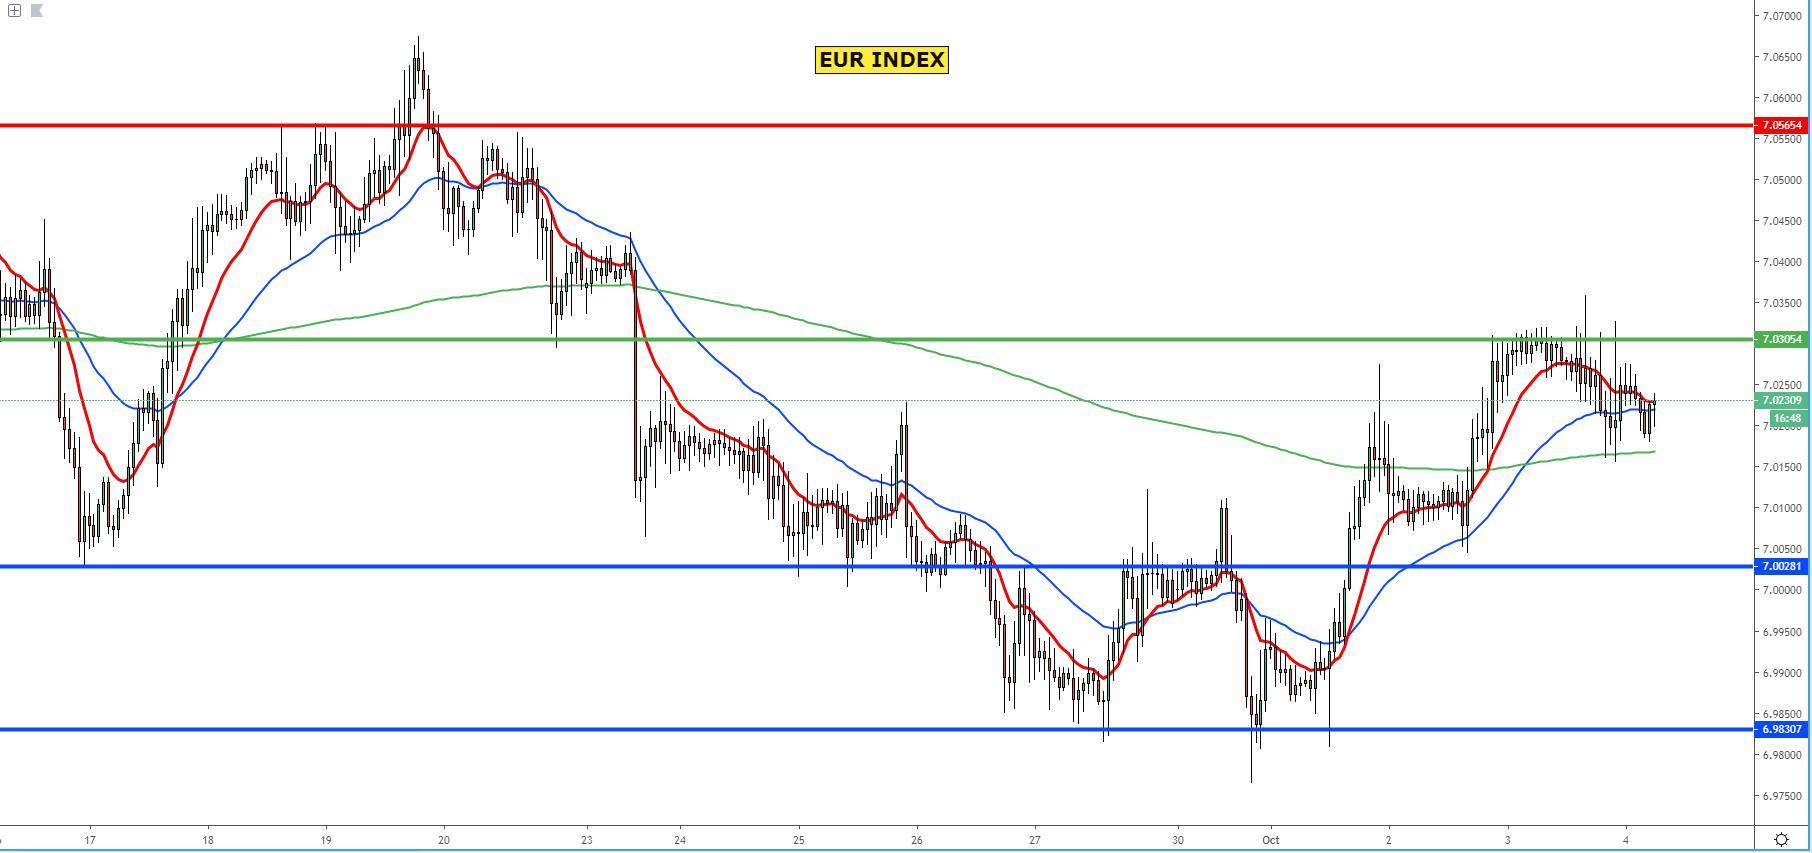
The EUR index had had to face a very stubborn area of supply, where continuous absorption of the emerging bids has been the predominant behaviour, with sellers holding the ground successfully so far, eventually causing the EUR to retrace back towards the daily baseline point. Keep trading the Euro short off the overhead area of supply on the hourly is still a sensible strategy if able to identify currencies with an improved demand outlook, while to the downside, the next notable area of demand lies over 0.25% lower in the form of a 8h level in blue, which has definitely gained credence after the successful upside rotation through Oct 2nd.
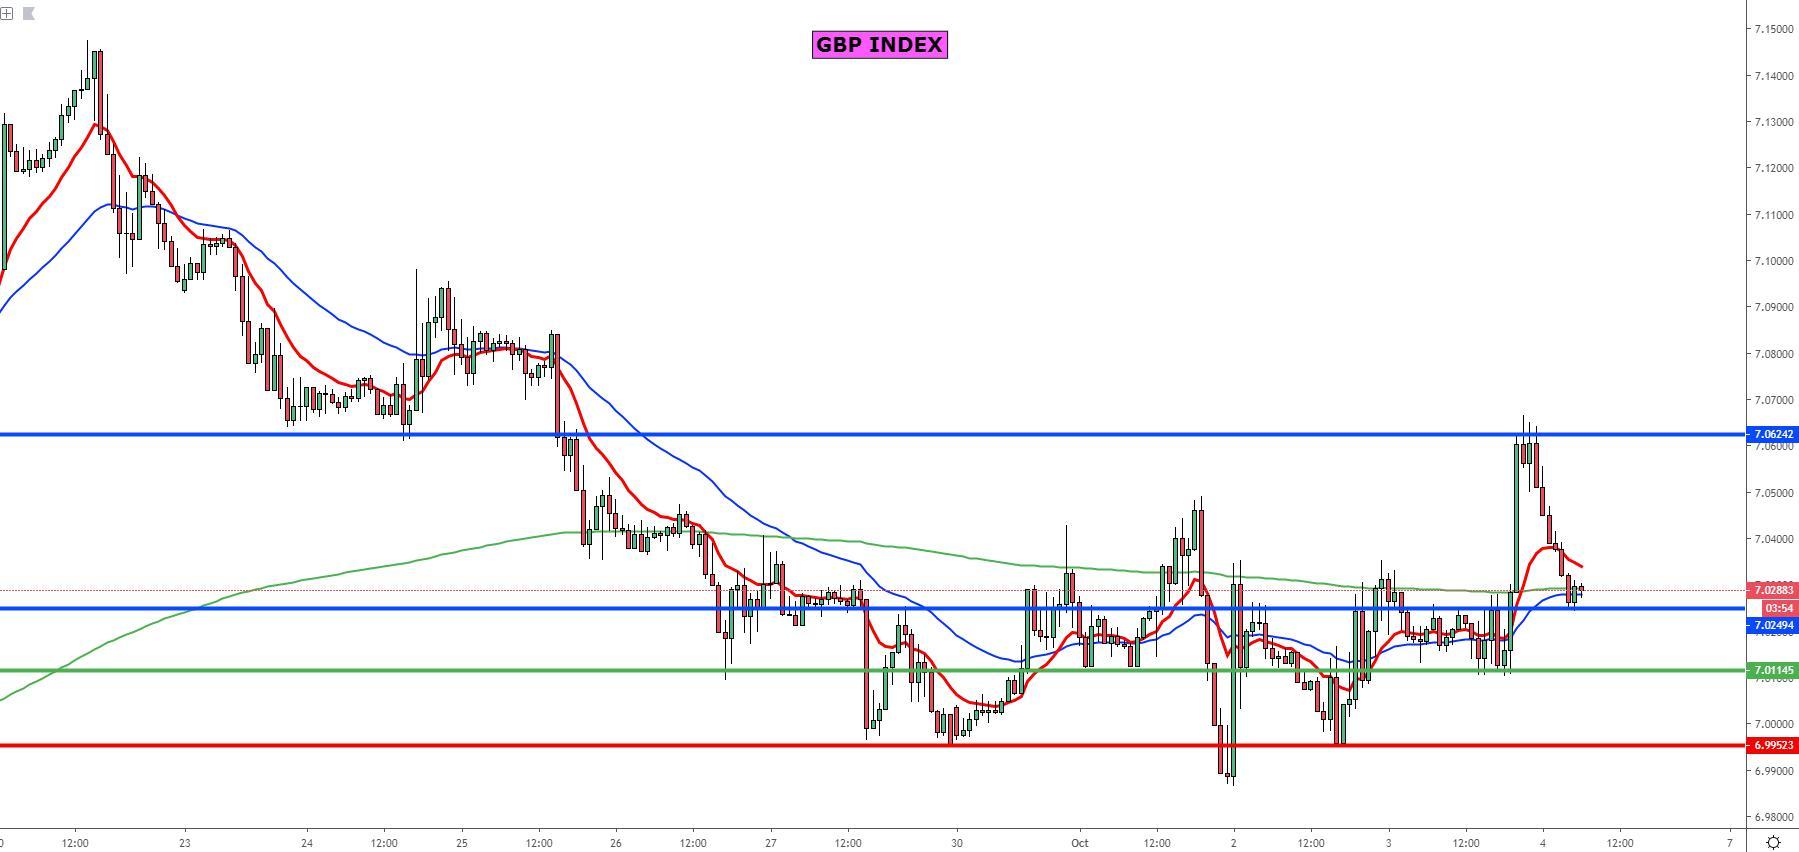
The GBP index has formed a successful bullish rotation, which makes a retest of the origin of demand a pristine location to engage in long-sided business opportunities along the blue line, which defines the area where the cluster of bids should be most evident. A penetration of the blue demand level will not necessarily cancel out the bullish outlook as the retest of the previous hourly low, given what the latest swing has achieved, should attract important buying interest. Even if the green hourly demand is broken, not far beyond a daily demand continues to provide strong support for the interest of buyers looking to find areas to reinstate positions.
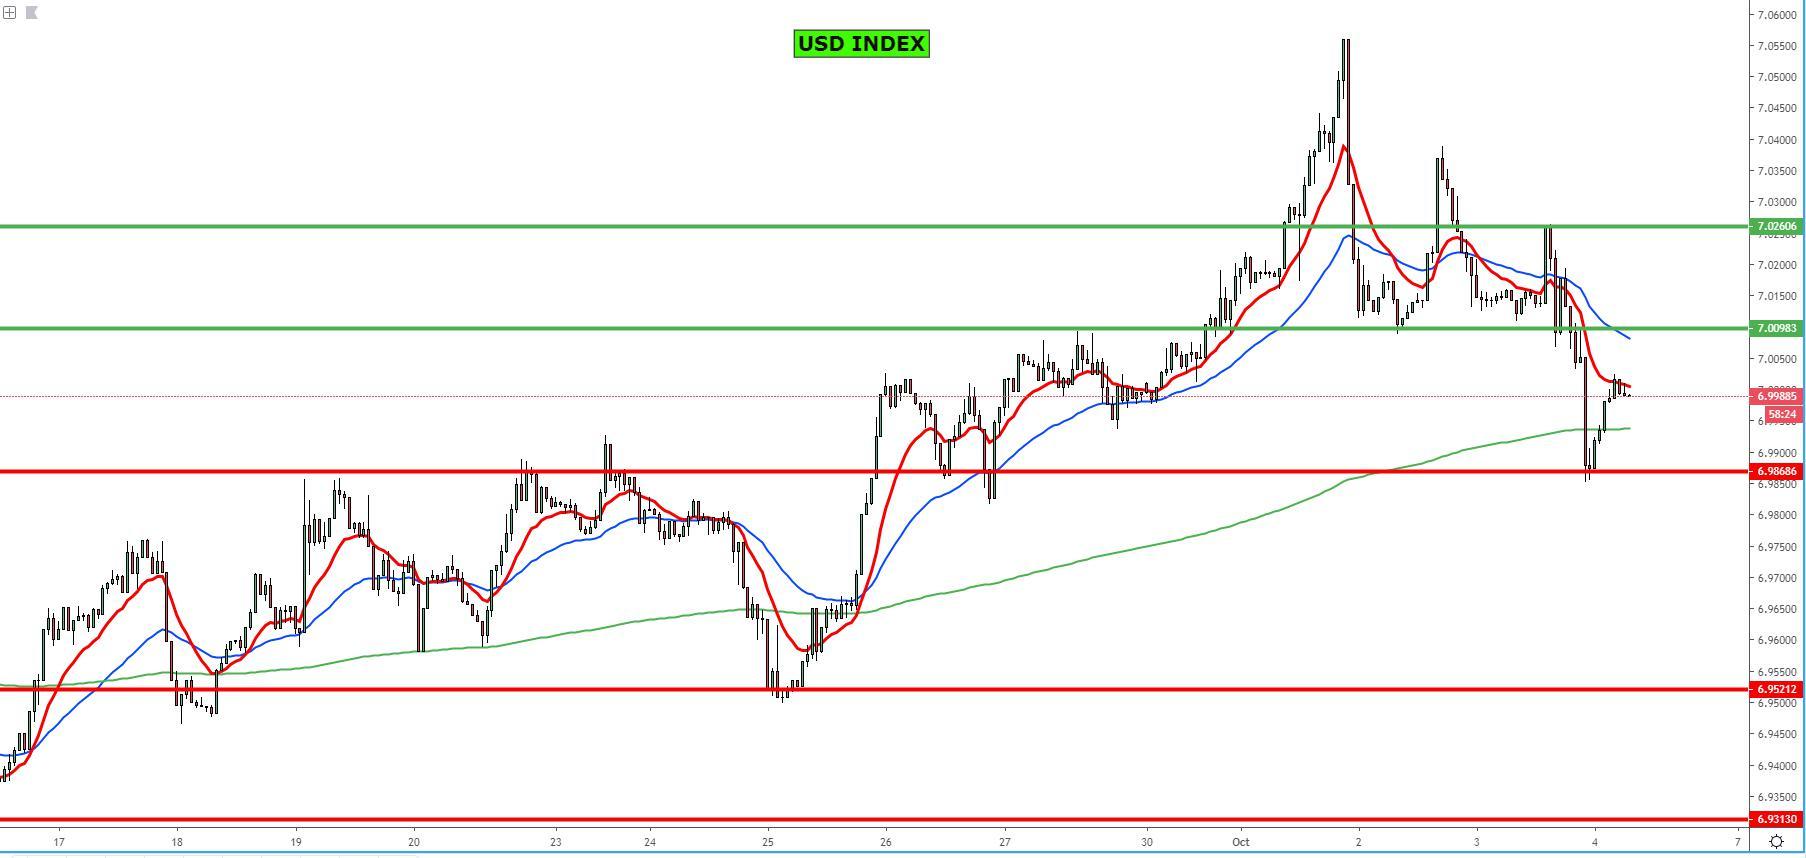
The USD index was marked down in an aggressive fashion as the market keeps pricing in further easing by the Fed in the immediate future, leading the index to test and reject a level of daily support, which would have been a great point of engagement against currencies facing supply at that time such as the Euro, where the cluster of offers was a common feature on Thursday. The index has now the daily support in control, with further bounces to see an hourly resistance level where supply is likely to arise around 0.15% from Thursday’s close. Bear in mind, today’s heightened volatility prospects in the USD due to the US NFP means one must stretch the levels to use as reference, which is why the outer levels identified must be taken into consideration.
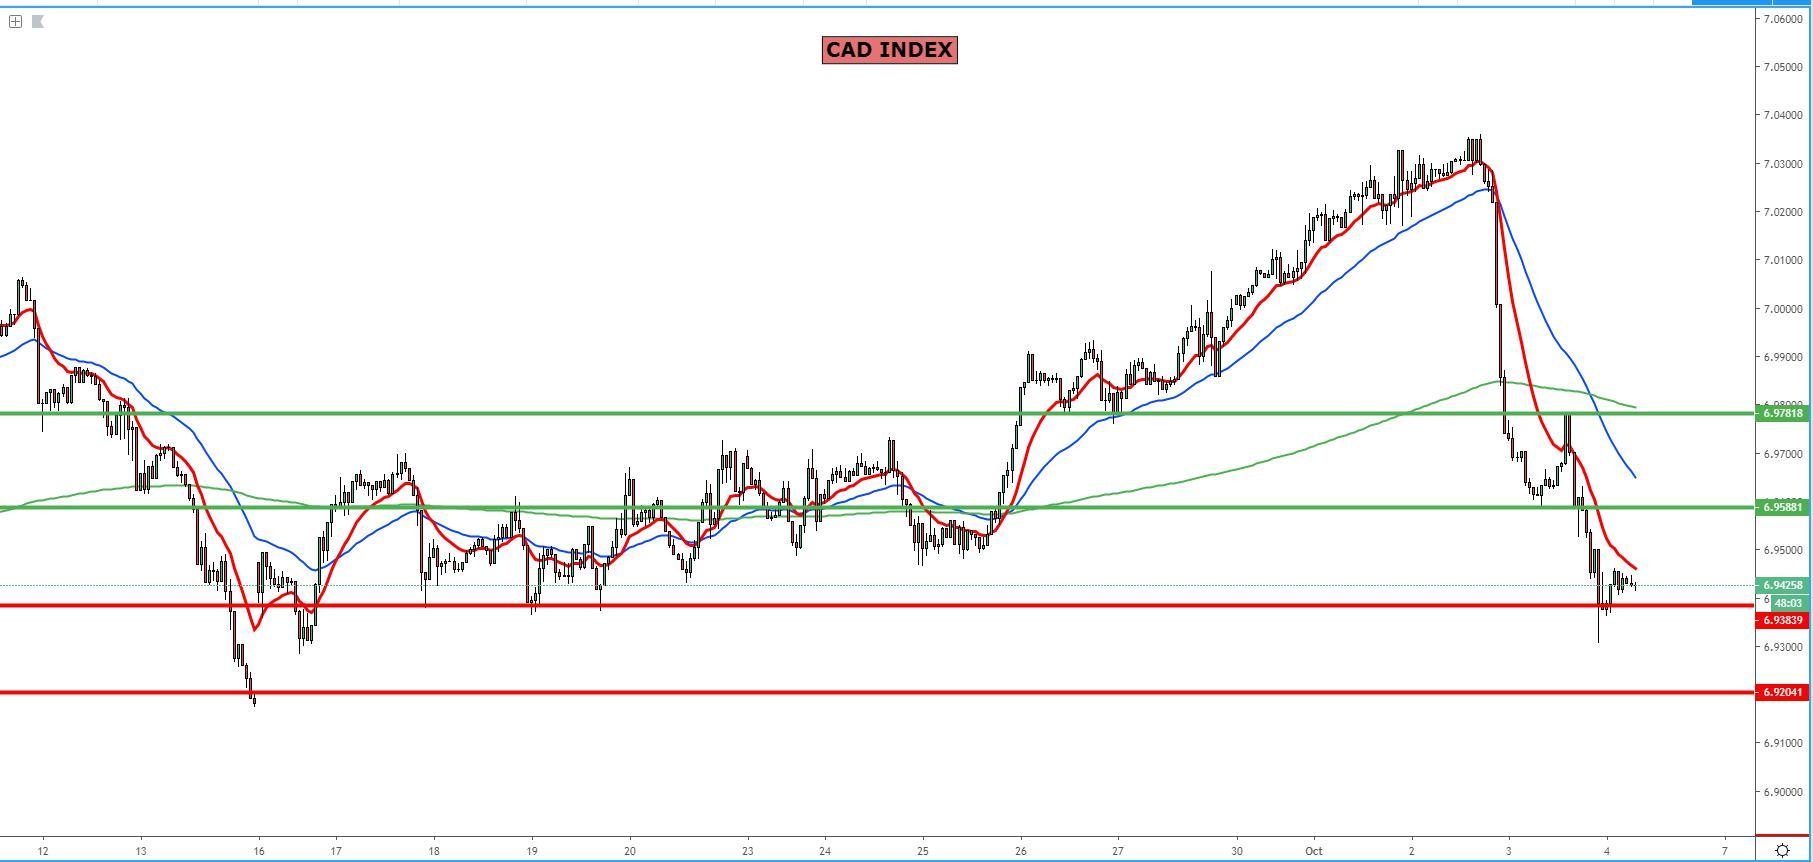
The CAD index found sufficient absorption on the way down to produce a minor recovery off a daily level of demand, which has now taken control, even if the rapid depreciation in the index makes any long position a risky one to hold heading into today’s US NFP. Given the sharp fall in the CAD, there are two new levels of hourly resistance worth marking in the chart, while to the downside, demand in the CAD off daily supports are also expected as per the red lines. Any of the levels should provide an initial reactionary point to speculate in CAD plays (longs or shorts). Note, if an elongated move up is seen, the outer hourly resistance carries a bigger weight given that it would potentially align with the baseline on the daily (13d ema).
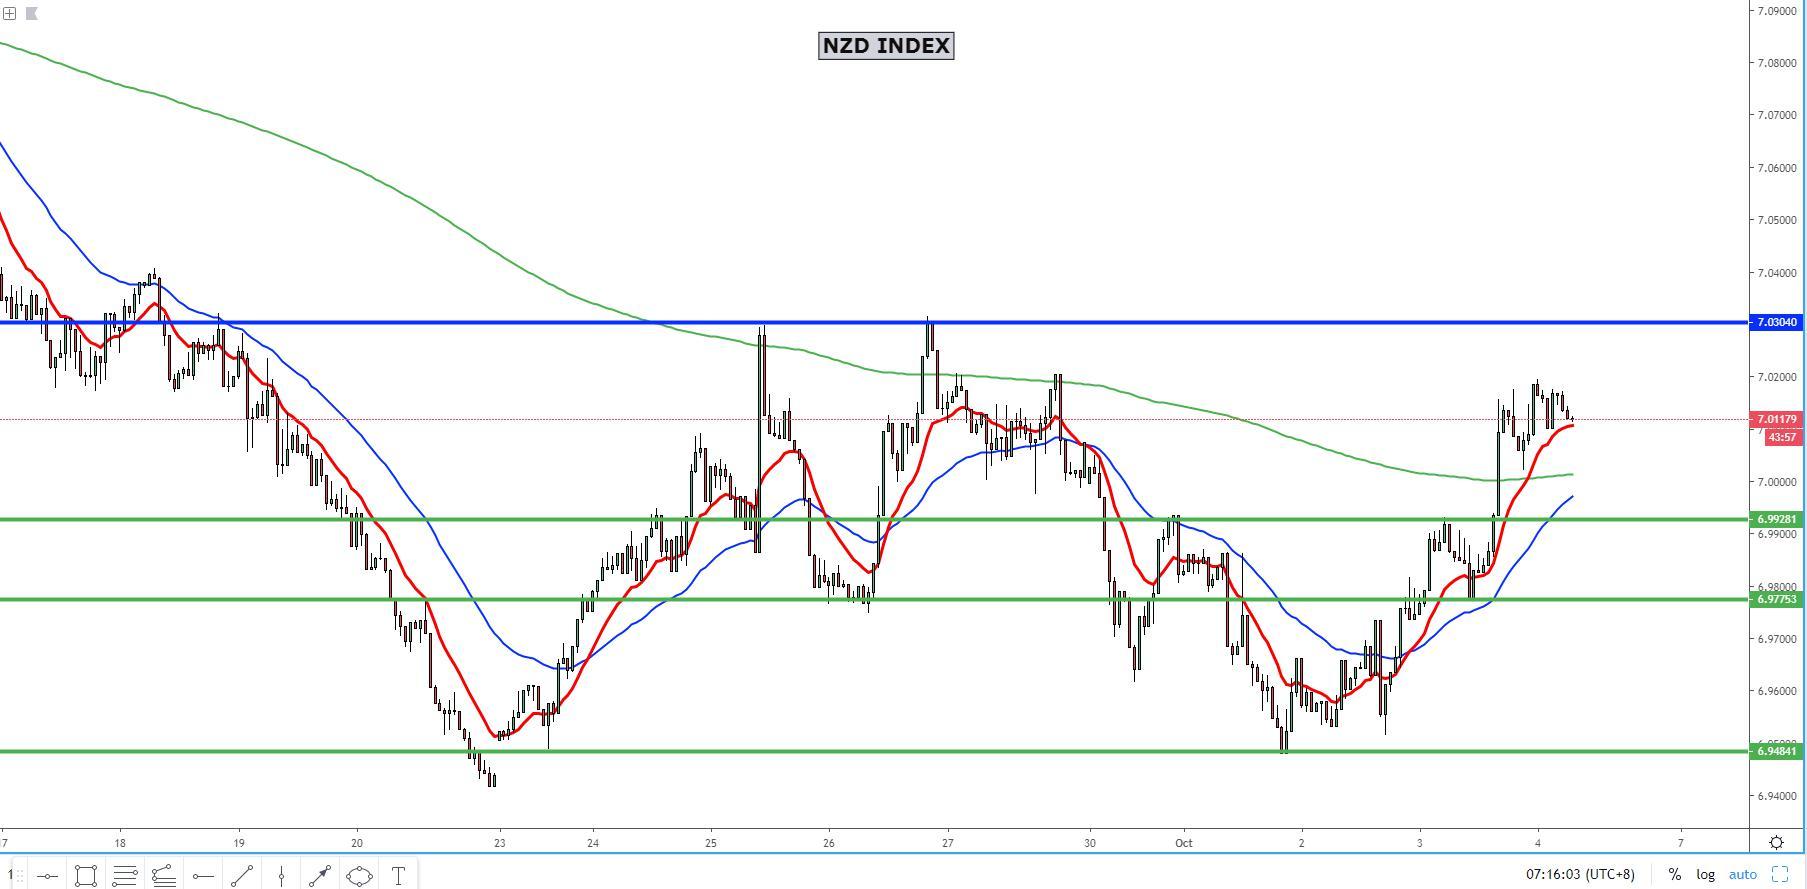
The NZD index has potentially further room to rise before confronted with the next level of resistance in the form of an 8h previous supply imbalance, which is where a turning point in the bullish tendencies is most likely to occur. To the downside, out of the hourly, up to three different levels of support can be spotted, even if the context to play longs could be seen as less than ideal given the overall bearish context in the index as the market now expects the RBNZ to be next in line to ease policy following in locksteps the move by the RBA to cut this week.
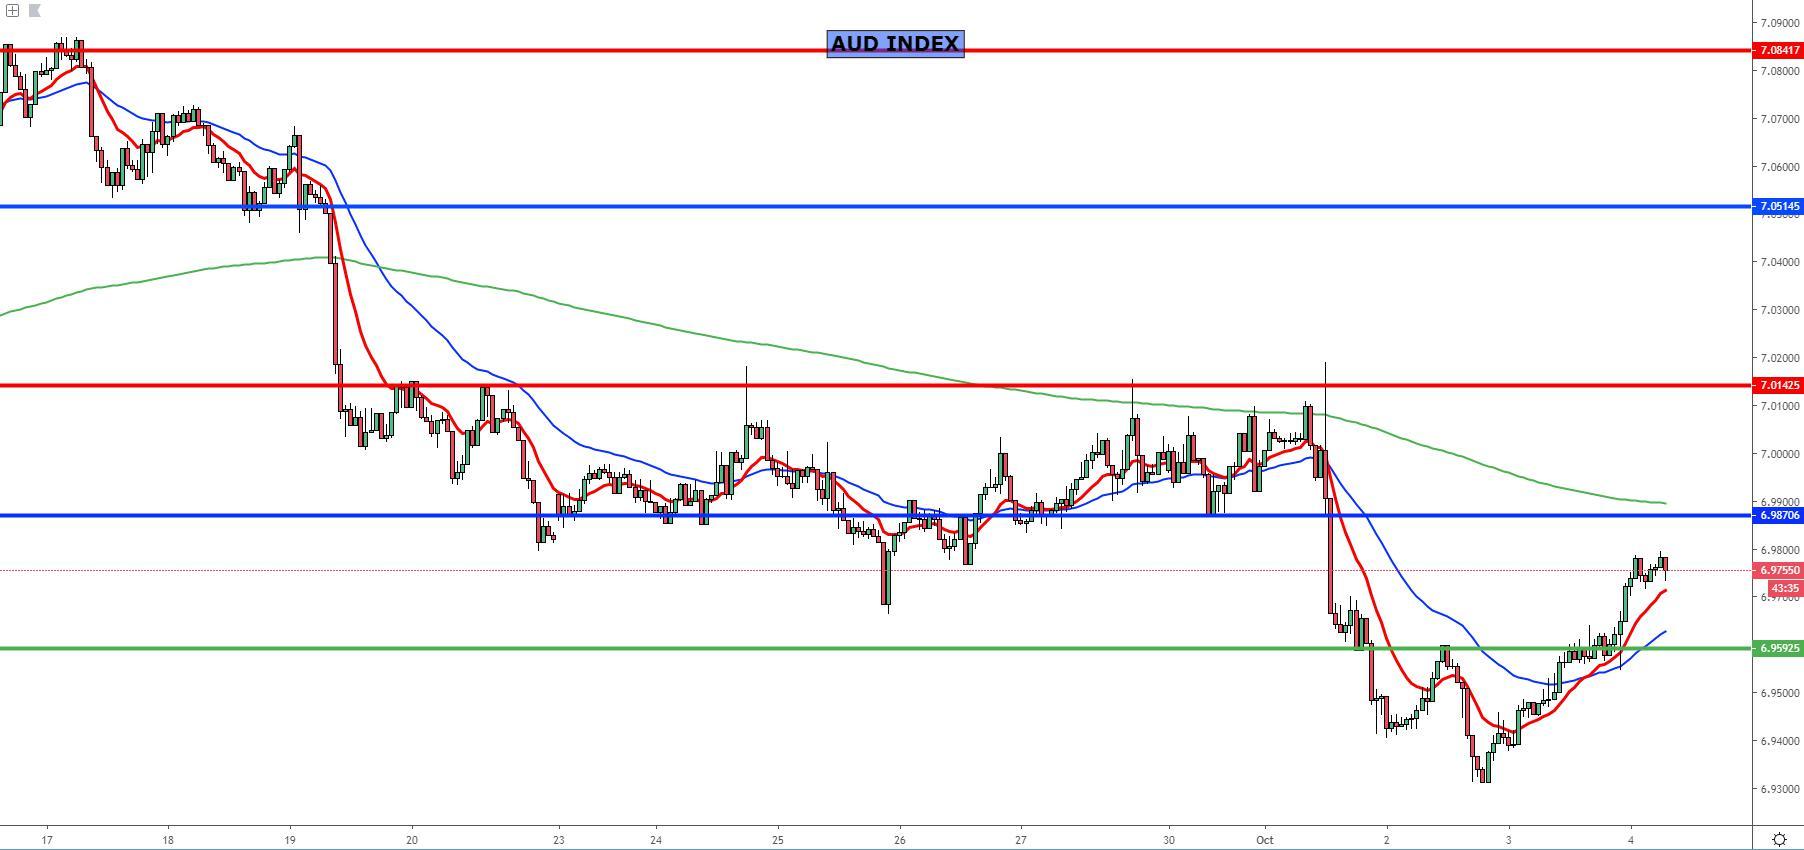
The AUD index is en-route to retest a level of resistance on the 8h chart, which should attract quite a lot of attention to reinstate short positions as it adds coincides not only with the 100% proj target off the last breakout point, but also sees the daily baseline intersection. One would have to price into the equation the volatility around the US NFP, which may initially distort the technicals, so always account for that event especially if by the time it comes due, the Aussie is nearby the area, which may see the initial withdrawal of liquidity by market makers an elongated move in either direction. If the Aussie can break higher, a huge level of resistance, rejected as many as 5 times before the RBA-induced bearish break, will be eyed.
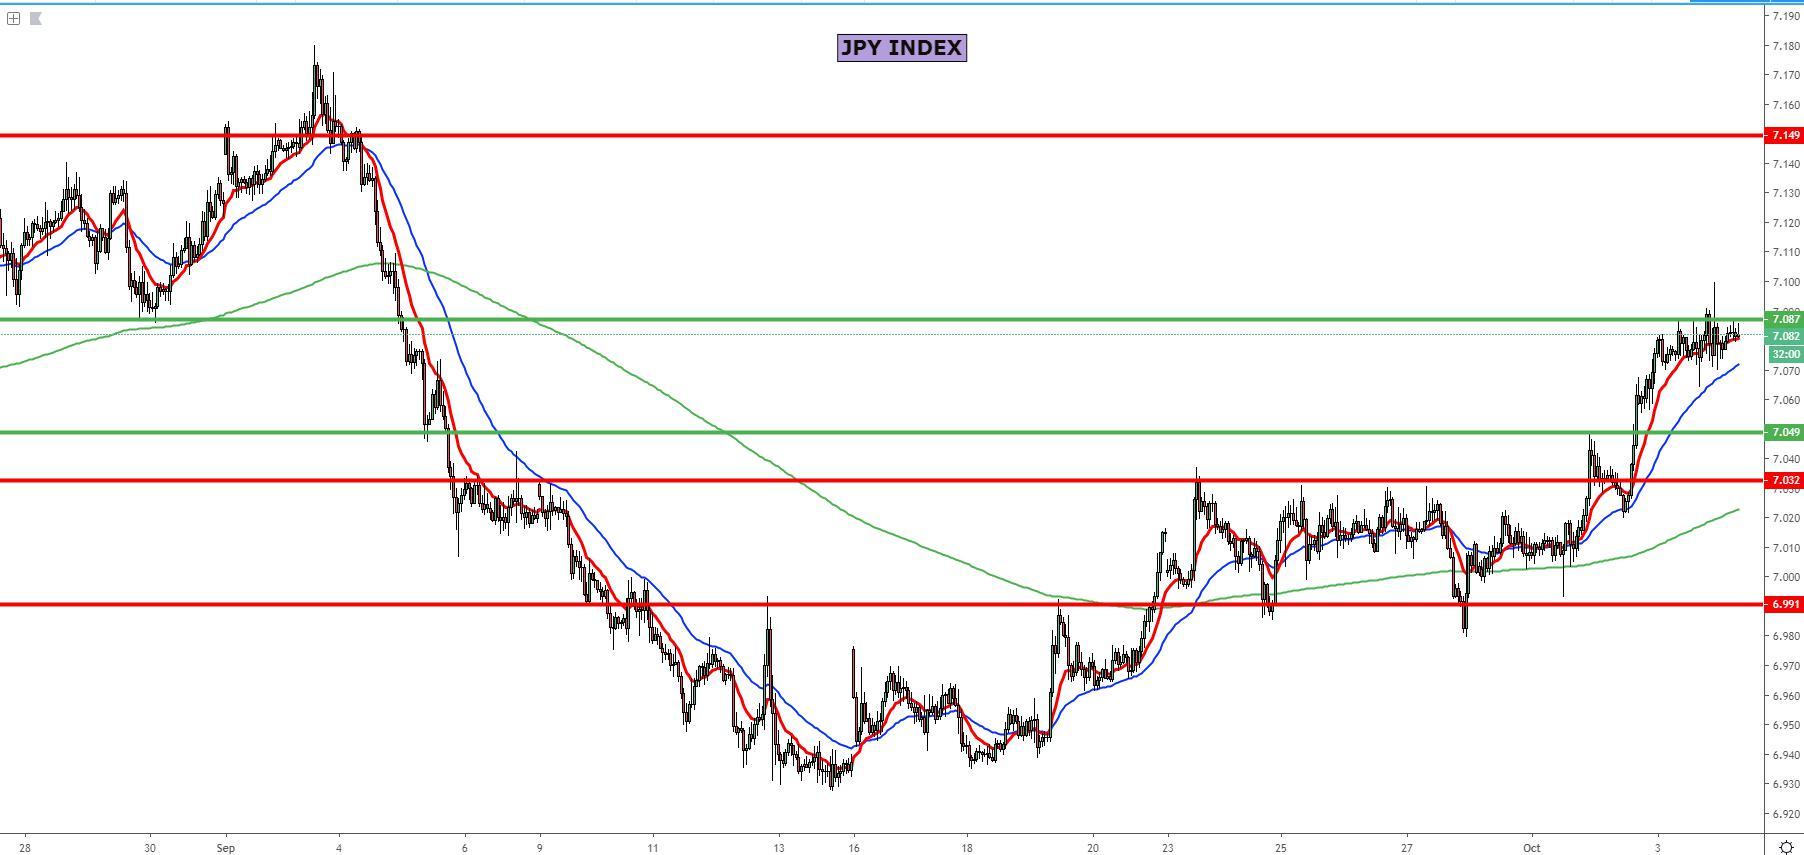
The JPY index has had a tough nut to crack in the form of an hourly resistance, which was always going to make it quite challenging to eat through the expected offers. The reason is because when the level was formed back in Aug 29, it represented a major swing low, which was broken very decisively by the supply flows at the time. Note, the level overhead no longer holds as much relevance to act as a turning point the more tests that it has as the offers gets absorbed, which diminishes the appeal of continuously playing JPY shorts off this level. What interesting is that based on the void areas in the chart, the Yen index faces the prospects of a much bigger move to the upside than to the downside, should the resistance be cleared.
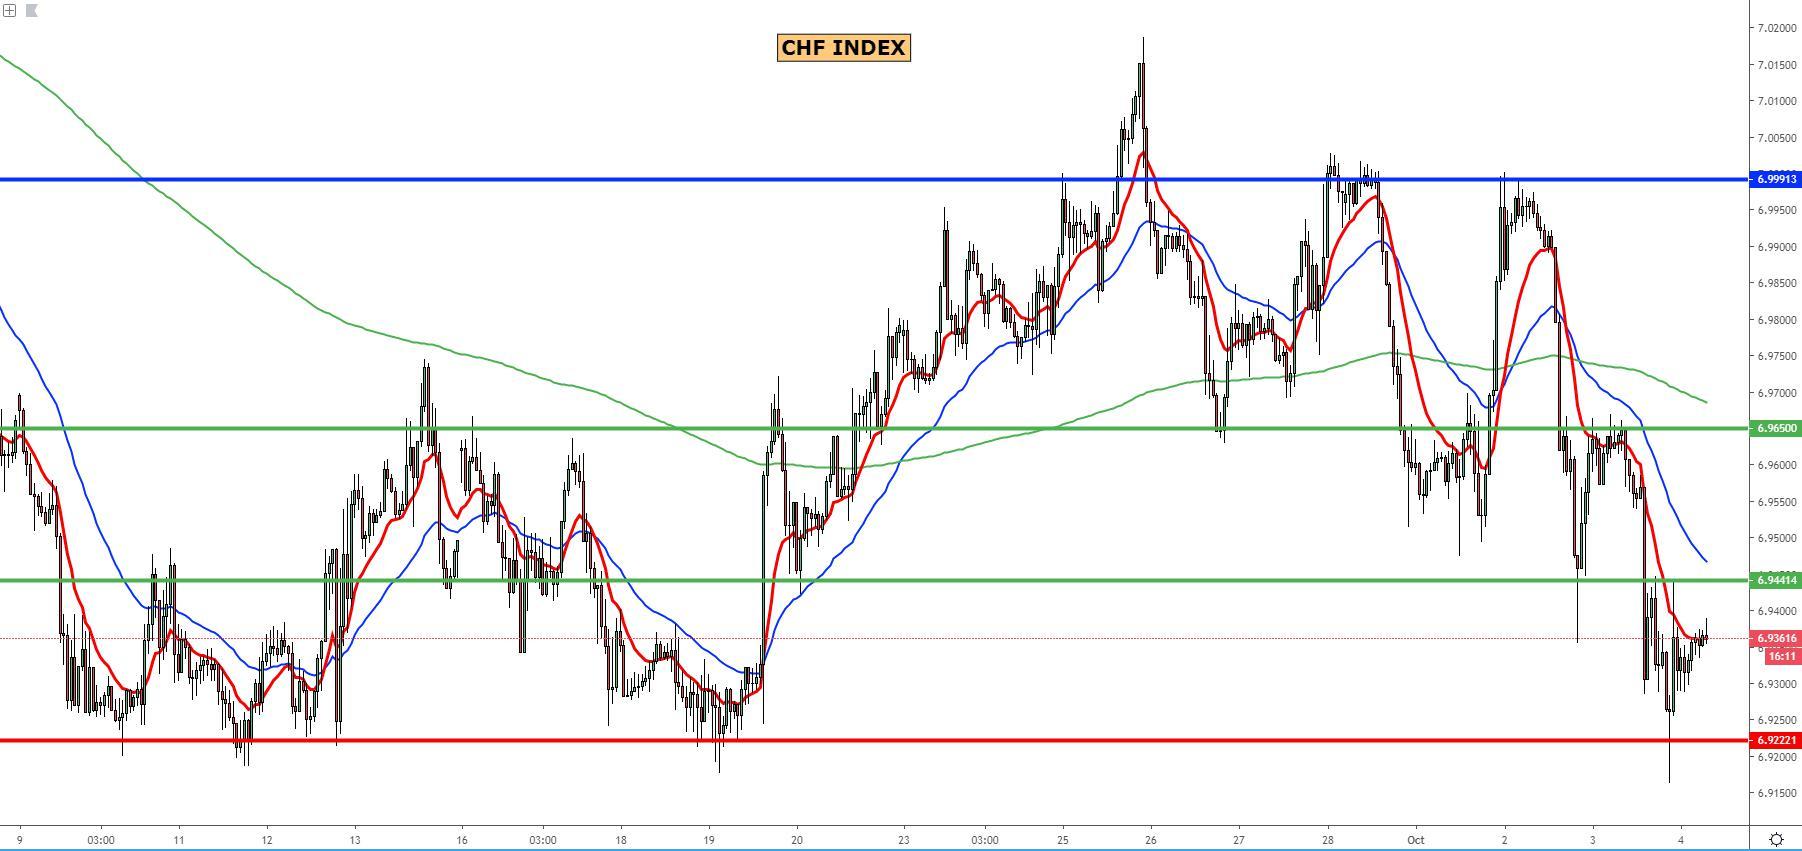
The CHF index has finally come to test a huge level of daily support, which judging by the type of rejection it had the last time the level was traded (it combined impulsivity in the mark up phase + it achieved a breakout of structure), one should expect demand to emerge. On the way up, the double rejection from an hourly level right overhead makes it a tradable point, but do be aware that the daily level has a far bigger weight than whatever hourly level is spotted, which means any shorts off hourly resistance face the clear risk of not holding for a prolonged period of time as the demand flows originating off the daily demand level should dominate.
Important Footnotes
- Risk model: The fact that financial markets have become so intertwined and dynamic makes it essential to stay constantly in tune with market conditions and adapt to new environments. This prop model will assist you to gauge the context that you are trading so that you can significantly reduce the downside risks. To understand the principles applied in the assessment of this model, refer to the tutorial How to Unpack Risk Sentiment Profiles
- Cycles: Markets evolve in cycles followed by a period of distribution and/or accumulation. To understand the principles applied in the assessment of cycles, refer to the tutorial How To Read Market Structures In Forex
- POC: It refers to the point of control. It represents the areas of most interest by trading volume and should act as walls of bids/offers that may result in price reversals. The volume profile analysis tracks trading activity over a specified time period at specified price levels. The study reveals the constant evolution of the market auction process. If you wish to find out more about the importance of the POC, refer to the tutorial How to Read Volume Profile Structures
- Tick Volume: Price updates activity provides great insights into the actual buy or sell-side commitment to be engaged into a specific directional movement. Studies validate that price updates (tick volume) are highly correlated to actual traded volume, with the correlation being very high, when looking at hourly data. If you wish to find out more about the importance tick volume, refer to the tutorial on Why Is Tick Volume Important To Monitor?
- Horizontal Support/Resistance: Unlike levels of dynamic support or resistance or more subjective measurements such as fibonacci retracements, pivot points, trendlines, or other forms of reactive areas, the horizontal lines of support and resistance are universal concepts used by the majority of market participants. It, therefore, makes the areas the most widely followed and relevant to monitor. The Ultimate Guide To Identify Areas Of High Interest In Any Market
- Trendlines: Besides the horizontal lines, trendlines are helpful as a visual representation of the trend. The trendlines are drawn respecting a series of rules that determine the validation of a new cycle being created. Therefore, these trendline drawn in the chart hinge to a certain interpretation of market structures.
- Correlations: Each forex pair has a series of highly correlated assets to assess valuations. This type of study is called inter-market analysis and it involves scoping out anomalies in the ever-evolving global interconnectivity between equities, bonds, currencies, and commodities. If you would like to understand more about this concept, refer to the tutorial How Divergence In Correlated Assets Can Help You Add An Edge.
- Fundamentals: It’s important to highlight that the daily market outlook provided in this report is subject to the impact of the fundamental news. Any unexpected news may cause the price to behave erratically in the short term.
- Projection Targets: The usefulness of the 100% projection resides in the symmetry and harmonic relationships of market cycles. By drawing a 100% projection, you can anticipate the area in the chart where some type of pause and potential reversals in price is likely to occur, due to 1. The side in control of the cycle takes profits 2. Counter-trend positions are added by contrarian players 3. These are price points where limit orders are set by market-makers. You can find out more by reading the tutorial on The Magical 100% Fibonacci Projection